
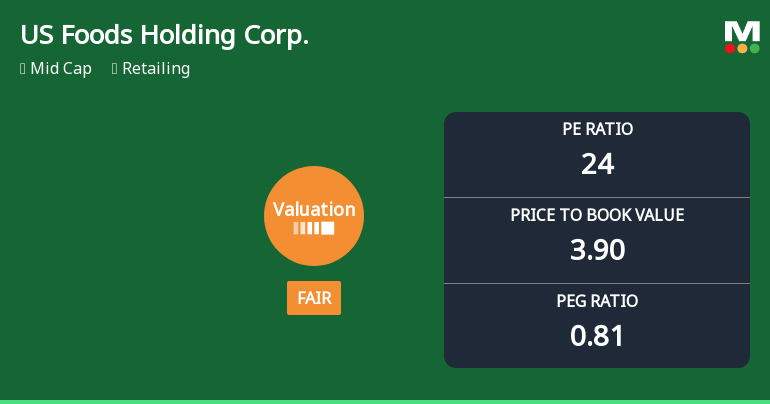
US Foods Holding Corp. Experiences Valuation Adjustment Amidst Evolving Financial Metrics
2025-11-10 16:11:02US Foods Holding Corp. has adjusted its valuation, reporting a P/E ratio of 24 and a price-to-book value of 3.90. The company shows a return on capital employed of 13.63% and a return on equity of 15.93%, indicating operational efficiency amid a mixed retail market landscape.
Read full news articleIs US Foods Holding Corp. technically bullish or bearish?
2025-11-05 11:23:29As of 31 October 2025, the technical trend for US Foods Holding Corp. has changed from mildly bearish to sideways. The current stance is neutral, with mixed indicators influencing the outlook. The weekly MACD and KST are both mildly bearish, while the monthly Bollinger Bands indicate a bullish sentiment. Daily moving averages show a mildly bullish trend, but overall, the lack of clear signals from the RSI and Dow Theory suggests indecision in the market. In terms of performance, US Foods has underperformed the S&P 500 over the past week and month, with returns of -1.09% and -3.66% compared to the S&P 500's gains of 0.71% and 1.92%, respectively. However, on a year-to-date basis, the stock has returned 8.79%, trailing the S&P 500's 16.30%. Over longer periods, such as 3 years and 5 years, US Foods has significantly outperformed the S&P 500....
Read full news article
US Foods Holding Corp. Experiences Revision in Stock Evaluation Amid Market Dynamics
2025-11-04 16:04:59US Foods Holding Corp. has recently revised its evaluation amid changing market conditions. The stock is currently priced at $73.70, reflecting a year-long performance of 19.95%, slightly surpassing the S&P 500. The company has demonstrated strong resilience, achieving significant returns over three and five years.
Read full news articleIs US Foods Holding Corp. technically bullish or bearish?
2025-11-04 11:35:17As of 31 October 2025, the technical trend for US Foods Holding Corp. has changed from mildly bearish to sideways. The current technical stance is neutral, with key indicators showing mixed signals. The MACD is mildly bearish on both weekly and monthly time frames, while the Bollinger Bands indicate a bearish weekly outlook but a mildly bullish monthly perspective. Moving averages are mildly bullish on a daily basis, and the On-Balance Volume (OBV) shows a mildly bullish weekly trend but is bearish monthly. In terms of performance, the stock has underperformed the S&P 500 over the past week and month, with returns of -0.67% and -3.26% compared to the S&P 500's 0.71% and 1.92%, respectively. However, it has outperformed the benchmark year-to-date and over the last three and five years....
Read full news articleIs US Foods Holding Corp. technically bullish or bearish?
2025-11-03 11:34:59As of 31 October 2025, the technical trend for US Foods Holding Corp. has changed from mildly bearish to sideways. The current stance is neutral, with mixed signals across various indicators. The MACD is mildly bearish on both weekly and monthly time frames, while the Bollinger Bands show a bearish outlook weekly but mildly bullish monthly. Moving averages indicate a mildly bullish trend on the daily chart, but the KST and Dow Theory remain mildly bearish on both weekly and monthly time frames. The OBV is mildly bullish weekly but bearish monthly. In terms of performance, the stock has underperformed the S&P 500 over the past week and month, with returns of -2.25% and -3.52% compared to the S&P 500's gains of 0.71% and 1.92%, respectively. However, it has outperformed the benchmark over longer periods, with a year-to-date return of 7.65% versus the S&P 500's 16.30%, and a three-year return of 144.02% comp...
Read full news articleIs US Foods Holding Corp. technically bullish or bearish?
2025-11-02 11:19:16As of 31 October 2025, the technical trend for US Foods Holding Corp. has changed from mildly bearish to sideways. The current stance is neutral, with mixed signals across various indicators. The MACD is mildly bearish on both weekly and monthly time frames, while the Bollinger Bands show a bearish weekly signal but a mildly bullish monthly signal. Moving averages indicate a mildly bullish trend on the daily chart. The KST and Dow Theory are both mildly bearish on weekly and monthly bases. The OBV shows a mildly bullish signal on the weekly but is mildly bearish monthly. In terms of performance, the stock has underperformed the S&P 500 over the past week and month, with returns of -2.25% and -3.52% compared to the S&P 500's gains of 0.71% and 1.92%, respectively. However, it has outperformed the benchmark significantly over the longer term, with a 3-year return of 144.02% versus the S&P 500's 76.66%....
Read full news article
Corporate Actions


