

Key Events This Week
8 Jun: Stock rises 1.61% to Rs.45.49 amid Sensex decline
9 Jun: Valuation shifts signal changing market perception
11 Jun: Golden Cross formation signals potential bullish breakout
12 Jun: Stock rebounds 2.65% to Rs.44.52, Sensex gains 2.20%
Golden Cross Forms in Vardhman Acrylics Ltd — On a Day the Stock Fell 1.8%. What the Mixed Signals Mean
2026-06-11 18:01:05The 50-day moving average has crossed above the 200-day moving average for Vardhman Acrylics Ltd, signalling a golden cross on 11 Jun 2026. Yet, the stock declined 1.81% on the day the cross formed, while monthly technical indicators remain mixed. This juxtaposition of signals calls for a detailed examination of the broader technical and fundamental context.
Read full news article
Vardhman Acrylics Ltd is Rated Hold by MarketsMOJO
2026-06-10 10:10:05Vardhman Acrylics Ltd is rated 'Hold' by MarketsMOJO, with this rating last updated on 02 May 2026. However, the analysis and financial metrics discussed here reflect the stock’s current position as of 10 June 2026, providing investors with an up-to-date view of the company’s fundamentals, returns, and market standing.
Read full news article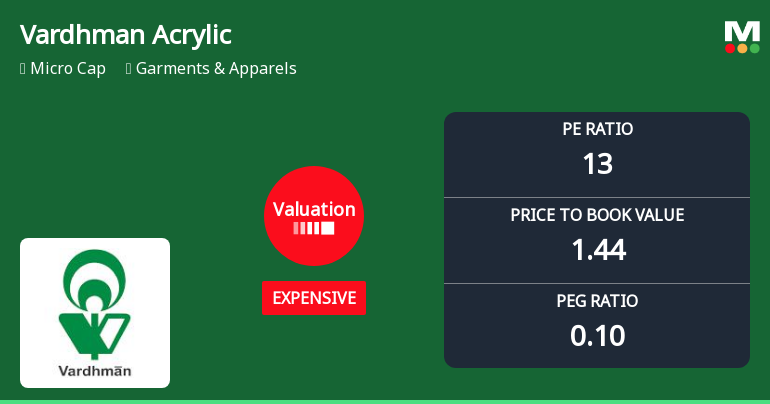
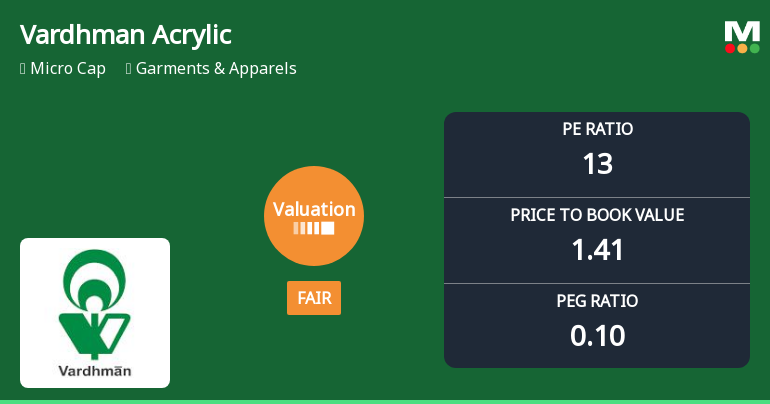
Vardhman Acrylics Ltd Valuation Shifts Signal Changing Market Perception
2026-06-09 08:00:36Vardhman Acrylics Ltd, a micro-cap player in the Garments & Apparels sector, has witnessed a notable shift in its valuation parameters, moving from a fair to an expensive rating. This article analyses the recent changes in key valuation metrics such as the price-to-earnings (P/E) and price-to-book value (P/BV) ratios, comparing them with historical averages and peer benchmarks to assess the stock’s price attractiveness amid evolving market conditions.
Read full news article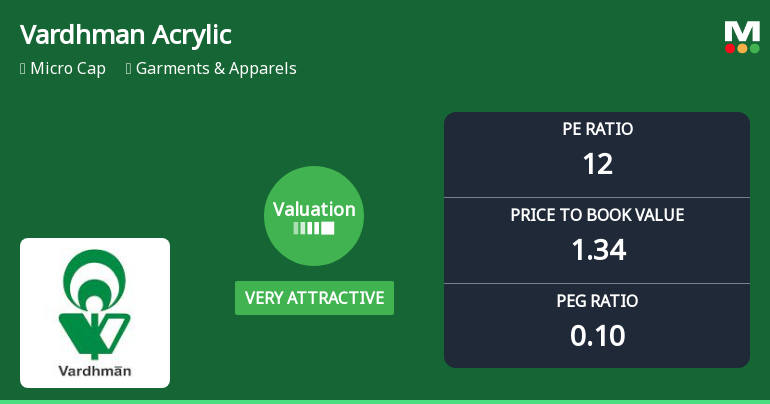
Vardhman Acrylics Ltd Valuation Shifts Signal Renewed Price Attractiveness
2026-06-01 08:04:38Vardhman Acrylics Ltd has witnessed a significant shift in its valuation parameters, moving from an attractive to a very attractive grade, driven by its compelling price-to-earnings (P/E) and price-to-book value (P/BV) ratios relative to historical levels and industry peers. Despite a recent 2.21% dip in share price, the micro-cap garment and apparel company’s fundamentals suggest a favourable entry point for investors seeking value in a challenging sector.
Read full news article
Vardhman Acrylics Ltd is Rated Hold
2026-05-27 10:11:05Vardhman Acrylics Ltd is rated 'Hold' by MarketsMOJO, with this rating last updated on 02 May 2026. However, the analysis and financial metrics discussed here reflect the stock's current position as of 27 May 2026, providing investors with the latest insights into its performance and outlook.
Read full news article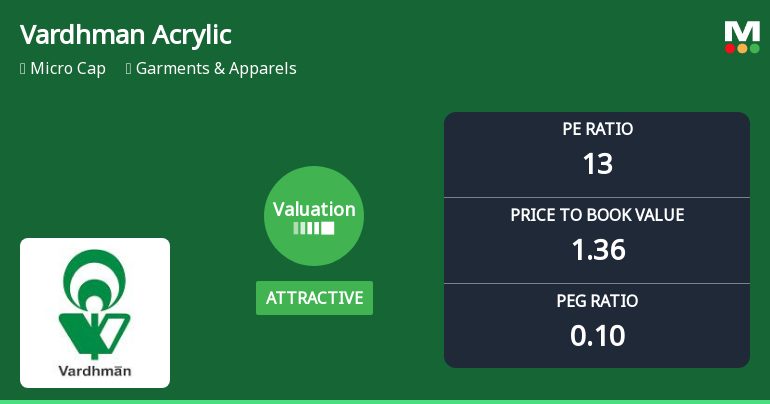
Vardhman Acrylics Ltd Valuation Shifts Signal Renewed Price Attractiveness
2026-05-18 08:01:55Vardhman Acrylics Ltd has witnessed a notable shift in its valuation parameters, moving from a fair to an attractive rating as of early January 2026. This change reflects improved price metrics relative to its historical averages and peer group, signalling a potential opportunity for investors in the garments and apparels sector.
Read full news article


