Key Events This Week
15 Jun: New 52-week high at Rs.651 and all-time high at Rs.647
18 Jun: New 52-week high at Rs.653 and all-time high at Rs.649.45
19 Jun: New 52-week high and all-time high at Rs.666
19 Jun: Week closes at Rs.657.25 (+4.72%) outperforming Sensex (+2.35%)

Vardhman Textiles Ltd is Rated Hold by MarketsMOJO
2026-06-19 10:10:04Vardhman Textiles Ltd is rated 'Hold' by MarketsMOJO, with this rating last updated on 03 February 2026. However, the analysis and financial metrics discussed here reflect the company’s current position as of 19 June 2026, providing investors with an up-to-date perspective on the stock’s fundamentals, valuation, financial trends, and technical outlook.
Read full news article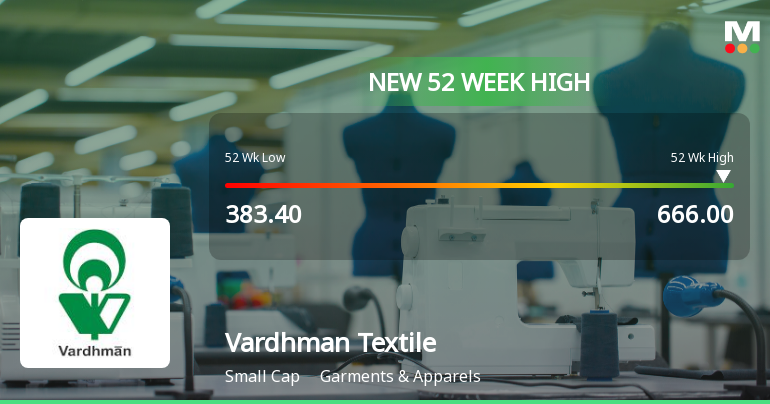
Broad-Based Technical Strength Lifts Vardhman Textiles Ltd to 52-Week High of Rs 666
2026-06-19 09:48:53Surging to a new 52-week high of Rs 666 on 19 Jun 2026, Vardhman Textiles Ltd has demonstrated remarkable price momentum, outperforming the Sensex by a wide margin over the past year. The stock’s ascent from its 52-week low of Rs 383.4 to this peak marks a 44.46% gain, while the benchmark index has declined by 5.75% in the same period, underscoring the strength of this rally.
Read full news article
Vardhman Textiles Ltd Hits All-Time High of Rs 666 as Momentum Builds Across Timeframes
2026-06-19 09:32:05Extending its recent rally, Vardhman Textiles Ltd touched a fresh all-time high of Rs 666 on 19 Jun 2026, marking a significant milestone in its price journey amid strong outperformance against the broader market.
Read full news article
Broad-Based Technical Strength Lifts Vardhman Textiles Ltd to 52-Week High of Rs 653
2026-06-18 14:35:34Surging past its previous peaks, Vardhman Textiles Ltd touched a fresh 52-week high of Rs 653 on 18 Jun 2026, marking a 38.21% gain over the past year and significantly outperforming the Sensex, which declined by 5.23% during the same period.
Read full news article
Vardhman Textiles Ltd Hits All-Time High of Rs 649 as Momentum Builds Across Timeframes
2026-06-18 14:30:13Extending its upward trajectory, Vardhman Textiles Ltd surged 3.77% on 18 Jun 2026 to close near its 52-week peak at Rs 649, marking a fresh all-time high. This move outpaced both the Sensex and its sector, reflecting robust momentum across multiple timeframes.
Read full news article
Broad-Based Technical Strength Lifts Vardhman Textiles Ltd to 52-Week High of Rs 651
2026-06-15 14:05:30Surging to an intraday peak of Rs 651 on 15 Jun 2026, Vardhman Textiles Ltd has marked a significant milestone by reaching a fresh 52-week high. This achievement comes amid a sustained rally that has seen the stock appreciate 34.05% over the past year, comfortably outperforming the Sensex’s decline of 5.77% during the same period.
Read full news article