
Is Vimeo, Inc. technically bullish or bearish?
2025-11-05 11:24:45As of 31 October 2025, the technical trend for Vimeo, Inc. has changed from mildly bullish to bullish. The weekly MACD is bullish, while the monthly MACD is mildly bullish. Daily moving averages also indicate a bullish stance. However, the weekly and monthly RSI readings are bearish, suggesting some weakness in momentum. The Bollinger Bands are mildly bullish on both weekly and monthly time frames, and the KST shows a bullish weekly trend but is mildly bearish monthly. Dow Theory and OBV indicate no trend in both weekly and monthly assessments. In terms of performance, Vimeo has outperformed the S&P 500 over multiple periods, with a year-to-date return of 21.72% compared to the S&P 500's 16.30%, and a one-year return of 60.29% versus 19.89%. Overall, the current technical stance is bullish, but the bearish RSI readings indicate caution....
Read MoreIs Vimeo, Inc. technically bullish or bearish?
2025-11-04 11:36:39As of 31 October 2025, the technical trend has changed from mildly bullish to bullish. The current stance is bullish, supported by a bullish MACD on the weekly timeframe and bullish signals from Bollinger Bands and daily moving averages. However, the RSI readings are bearish on both weekly and monthly timeframes, indicating some weakness. The KST is bullish weekly but mildly bearish monthly, while Dow Theory shows a mildly bullish stance in both timeframes. In terms of performance, Vimeo, Inc. has outperformed the S&P 500 with a year-to-date return of 21.56% compared to 16.30% for the index, and a one-year return of 60.08% versus 19.89%....
Read MoreIs Vimeo, Inc. technically bullish or bearish?
2025-11-02 11:20:14As of 31 October 2025, the technical trend for Vimeo, Inc. has changed from mildly bullish to bullish. The current stance is bullish with a strong indication from the daily moving averages and weekly Bollinger Bands, both signaling bullish momentum. However, the weekly and monthly RSI readings are bearish, which suggests some caution. The KST is bullish on a weekly basis but mildly bearish monthly, indicating mixed signals over different time frames. In terms of performance, Vimeo has outperformed the S&P 500 across multiple periods, with a year-to-date return of 21.87% compared to the S&P 500's 16.30%, and a one-year return of 63.52% versus 19.89% for the benchmark. Overall, the technical indicators suggest a bullish outlook, albeit with some bearish divergence in the RSI that may warrant attention....
Read More
Vimeo, Inc. Experiences Revision in Stock Evaluation Amid Strong Market Performance
2025-10-28 16:05:39Vimeo, Inc. has recently revised its evaluation amid current market dynamics, with its stock price at $7.78. Over the past year, the company has achieved a 64.83% return, significantly outperforming the S&P 500. Various technical indicators present a mixed outlook, reflecting both bullish and bearish conditions.
Read MoreIs Vimeo, Inc. technically bullish or bearish?
2025-10-28 11:46:11As of 24 October 2025, the technical trend for Vimeo, Inc. has changed from mildly bullish to bullish. The weekly MACD is bullish, and the daily moving averages are also bullish, supporting the positive stance. However, the weekly and monthly RSI readings are bearish, indicating some weakness. The Bollinger Bands are bullish on both weekly and monthly time frames, while the KST shows a bullish weekly trend but is mildly bearish monthly. Dow Theory reflects a mildly bullish stance on both weekly and monthly charts. In terms of performance, Vimeo has outperformed the S&P 500 significantly over the YTD (21.56% vs. 15.47%) and 1Y (64.83% vs. 16.90%) periods, and also over the 3Y period (113.15% vs. 78.85%). Overall, the current technical stance is bullish, albeit with some caution due to bearish RSI readings....
Read MoreIs Vimeo, Inc. technically bullish or bearish?
2025-10-27 11:57:07As of 24 October 2025, the technical trend for Vimeo, Inc. has changed from mildly bullish to bullish. The weekly MACD is bullish, and both the Bollinger Bands and daily moving averages indicate a bullish stance. However, the weekly and monthly RSI readings are bearish, which suggests some weakness in momentum. The KST is bullish on a weekly basis but mildly bearish monthly, while Dow Theory shows a mildly bullish trend in both time frames. In terms of performance, Vimeo has outperformed the S&P 500 year-to-date with a return of 21.56% compared to 15.47%, and over the past year, it has significantly outperformed with a return of 64.83% versus 16.90%. Overall, the current technical stance is bullish, albeit with some mixed indicators suggesting caution....
Read MoreIs Vimeo, Inc. technically bullish or bearish?
2025-10-26 11:32:32As of 24 October 2025, the technical trend for Vimeo, Inc. has changed from mildly bullish to bullish. The weekly MACD is bullish, and the daily moving averages are also bullish, supporting a positive outlook. However, the weekly and monthly RSI readings are bearish, indicating some weakness in momentum. The Bollinger Bands are bullish on both weekly and monthly time frames, which suggests potential upward price movement. The KST is bullish weekly but mildly bearish monthly, while Dow Theory shows a mildly bullish stance in both time frames. In terms of performance, Vimeo has outperformed the S&P 500 year-to-date with a return of 21.56% compared to 15.47%, and over the past year, it has significantly outperformed with a return of 64.83% versus 16.90%. Overall, the current technical stance is bullish, albeit with some mixed signals from the RSI....
Read MoreIs Vimeo, Inc. overvalued or undervalued?
2025-10-21 12:13:45As of 17 October 2025, the valuation grade for Vimeo, Inc. has moved from attractive to very expensive, indicating a shift towards overvaluation. The company appears overvalued based on its high P/E ratio of 44, an EV to EBIT of 43.85, and an EV to EBITDA of 38.12, which are significantly above the industry averages. In comparison, peers such as Grindr, Inc. have a P/E of 43.60 and an EV to EBITDA of 27.75, while fuboTV, Inc. shows a more attractive valuation with a P/E of -10.59 and an EV to EBITDA of -18.21. Despite its recent stock performance, which has outpaced the S&P 500 with a year-to-date return of 20.94% compared to the S&P's 13.30%, the elevated valuation ratios suggest that Vimeo, Inc. is not a compelling investment at its current price of 7.74....
Read More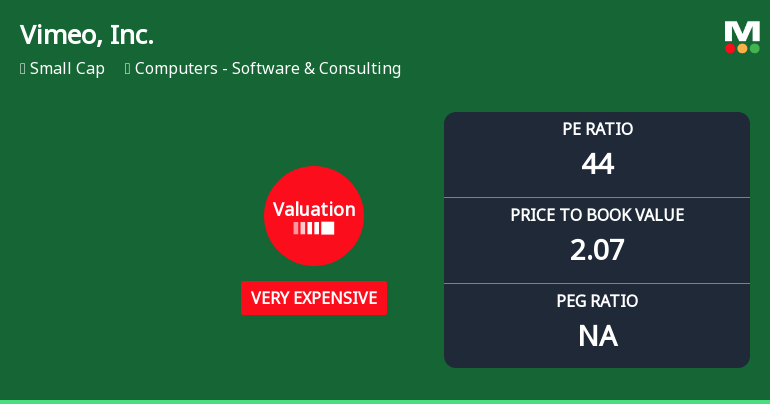
Vimeo, Inc. Experiences Valuation Adjustment Amid Strong Performance Metrics and Competitive Landscape
2025-10-20 17:37:27Vimeo, Inc. has recently adjusted its valuation, with a current P/E ratio of 44 and a Price to Book Value of 2.07. The company has demonstrated strong performance, achieving notable returns year-to-date and over the past year, while its valuation metrics indicate a competitive position within the industry.
Read More
Corporate Actions


