
Key Events This Week
15 Jun: Stock steady at Rs.113.25 despite Sensex rally
16 Jun: Valuation shifts signal attractive entry amid mixed market returns
19 Jun: Stock hits lower circuit, closing at Rs.107.60 (-4.99%)
Jul 14, 03:30 PM
BSE+NSE Vol: 1000

Visaman Global Sales Ltd is rated Strong Sell by MarketsMOJO, with this rating last updated on 27 May 2026. However, the analysis and financial metrics discussed here reflect the company’s current position as of 15 July 2026, providing investors with an up-to-date perspective on the stock’s fundamentals, valuation, financial trend, and technical outlook.
Read full news article
Visaman Global Sales Ltd is rated Strong Sell by MarketsMOJO. This rating was last updated on 27 May 2026. However, the analysis and financial metrics discussed below reflect the stock’s current position as of 04 July 2026, providing investors with the most recent and relevant data to assess the company’s outlook.
Read full news article
Visaman Global Sales Ltd is rated Strong Sell by MarketsMOJO, with this rating last updated on 27 May 2026. However, the analysis and financial metrics discussed here reflect the stock's current position as of 23 June 2026, providing investors with the latest insights into its performance and outlook.
Read full news article
15 Jun: Stock steady at Rs.113.25 despite Sensex rally
16 Jun: Valuation shifts signal attractive entry amid mixed market returns
19 Jun: Stock hits lower circuit, closing at Rs.107.60 (-4.99%)
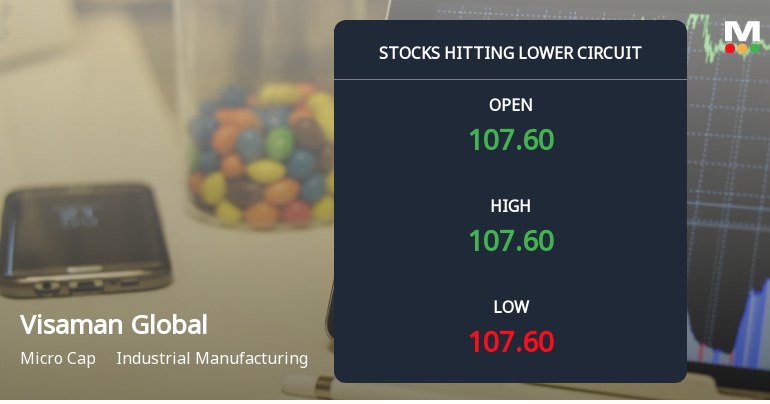
At Rs 107.6, sellers were still queuing — but there were no buyers willing to take the other side. Visaman Global Sales Ltd locked at its lower circuit of 4.99% on 19 Jun 2026, with unfilled sell orders and a frozen price.
Read full news article
Visaman Global Sales Ltd, a micro-cap player in the industrial manufacturing sector, has seen a notable shift in its valuation parameters, moving from a fair to an attractive rating. Despite a challenging year-to-date return of -12.14%, the company’s price-to-earnings (P/E) and price-to-book value (P/BV) ratios suggest a compelling investment case when compared with peers and historical benchmarks.
Read full news article
Visaman Global Sales Ltd is rated Strong Sell by MarketsMOJO. This rating was last updated on 27 May 2026, reflecting a new assessment of the stock’s outlook. However, all fundamentals, returns, and financial metrics discussed here are current as of 11 June 2026, providing investors with the latest perspective on the company’s position.
Read full news article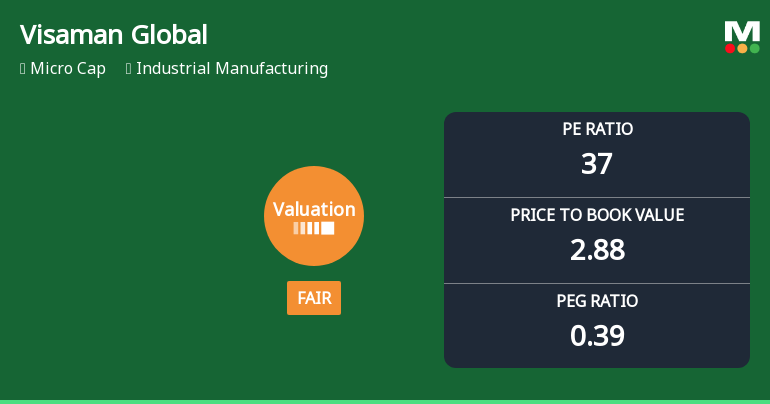
Visaman Global Sales Ltd, a micro-cap player in the industrial manufacturing sector, has experienced a notable shift in its valuation parameters, moving from an attractive to a fair rating. This change reflects evolving market perceptions amid a backdrop of mixed financial metrics and peer comparisons, raising important considerations for investors assessing the stock’s price attractiveness.
Read full news article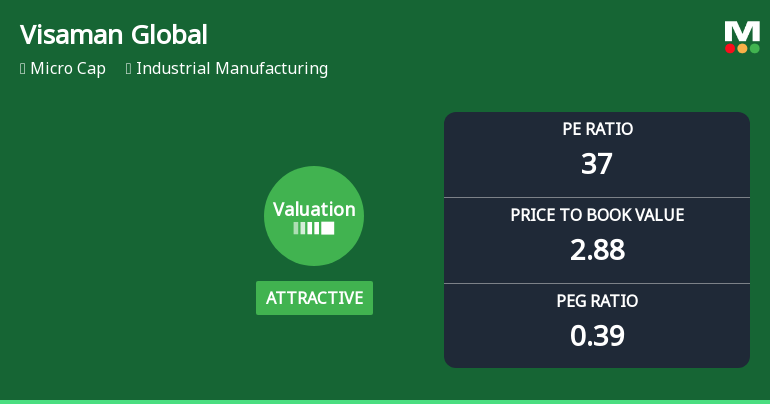
Visaman Global Sales Ltd, a micro-cap player in the industrial manufacturing sector, has recently seen a notable shift in its valuation parameters, moving from a non-qualifying to an attractive valuation grade. This change is underscored by its price-to-earnings (P/E) ratio, price-to-book value (P/BV), and other key metrics, positioning the stock as an intriguing option amid a challenging market backdrop.
Read full news article

No Upcoming Board Meetings

No Dividend history available

No Splits history available

No Bonus history available

No Rights history available


