
Key Events This Week
29 Jun: Surge in open interest signals bullish positioning
30 Jun: New 52-week high at Rs.1,127.45
2 Jul: Mojo rating downgraded from Strong Buy to Buy; valuation shifts to fair
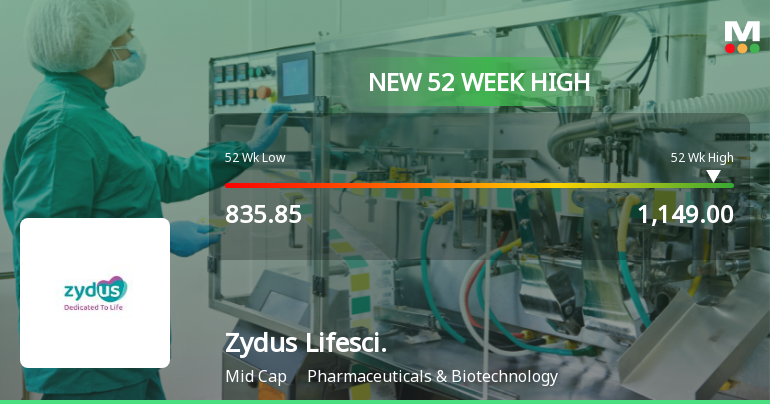
3 Jul: Stock hits new 52-week high intraday at Rs.1,128.45

Broad-Based Technical Strength Lifts Zydus Lifesciences Ltd to 52-Week High of Rs 1128.45
2026-07-03 12:05:53With a decisive intraday high of Rs 1128.45 on 3 Jul 2026, Zydus Lifesciences Ltd has reached a fresh 52-week peak, closing just 0.12% shy of this milestone. This advance comes amid a broader sector rally, with NIFTY PHARMA and S&P Bse Healthcare indices also hitting new highs, underscoring the momentum in the pharmaceuticals space.
Read full news article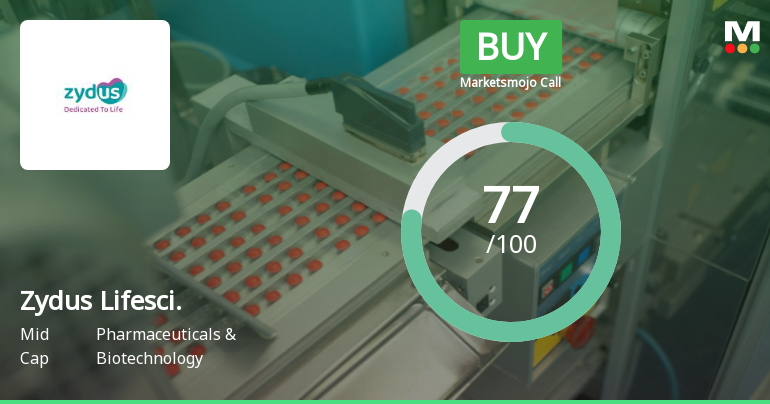
Zydus Lifesciences Ltd Downgraded to 'Buy' by MarketsMOJO on Valuation Concerns
2026-07-02 08:25:28Zydus Lifesciences Ltd has seen its investment rating downgraded from Strong Buy to Buy, primarily driven by a reassessment of its valuation metrics despite maintaining robust financial and quality parameters. The mid-cap pharmaceutical company’s recent performance and market positioning continue to impress, but a shift in valuation grade from attractive to fair has prompted a more cautious stance among analysts.
Read full news article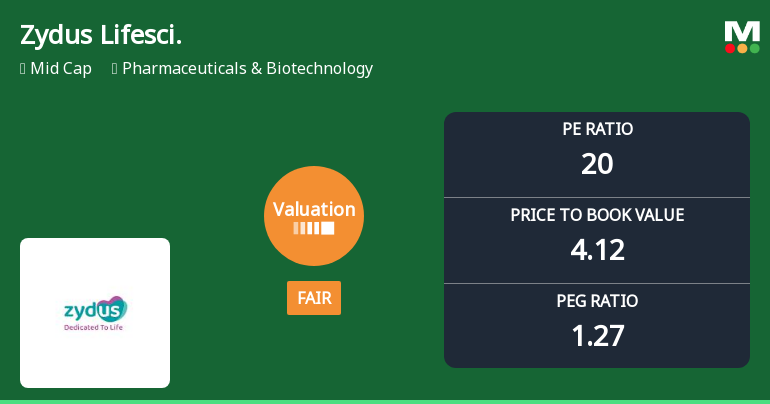
Zydus Lifesciences Ltd Valuation Shifts: From Attractive to Fair Amid Sector Dynamics
2026-07-02 08:01:11Zydus Lifesciences Ltd, a prominent player in the Pharmaceuticals & Biotechnology sector, has witnessed a notable shift in its valuation parameters, moving from an attractive to a fair rating. This change reflects evolving market perceptions amid sector-wide valuation adjustments and peer comparisons, despite the company’s robust financial performance and strong returns relative to the broader market.
Read full news article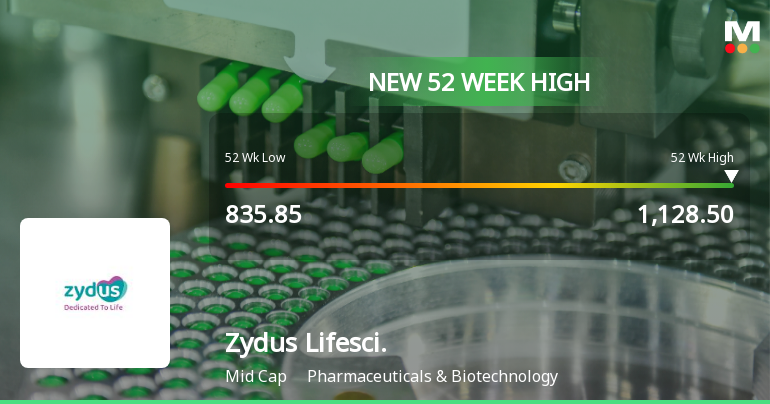
Zydus Lifesciences Sees Significant Open Interest Surge Signalling Bullish Market Positioning
2026-06-29 15:00:12Zydus Lifesciences Ltd has witnessed a notable surge in open interest in its derivatives segment, signalling increased market participation and potential directional bets. The stock, trading close to its 52-week high, has outperformed its sector and demonstrated strong technical momentum, reflecting growing investor confidence amid evolving market dynamics.
Read full news articleZydus Lifesciences Gains 2.86%: 6 Key Factors Driving the Week’s Momentum
2026-06-28 10:00:49
Key Events This Week
22 Jun: Stock opens strong at Rs.1,084.35 (+1.26%)
23 Jun: New 52-week high at Rs.1,124.10 and upgrade to Strong Buy
24 Jun: Further 52-week high at Rs.1,126.25 amid open interest surge
25 Jun: Sharp open interest increase signals bullish positioning
25 Jun: Week closes at Rs.1,101.50 (+2.86% weekly gain)
Zydus Lifesciences Sees Sharp Open Interest Surge Signalling Bullish Market Positioning
2026-06-25 15:00:18Zydus Lifesciences Ltd has witnessed a notable surge in open interest (OI) in its derivatives segment, with an 11.32% increase to 23,835 contracts from 21,411 previously. This rise, coupled with robust volume and price action near its 52-week high, suggests growing bullish sentiment and strategic positioning by market participants in the pharmaceuticals and biotechnology sector.
Read full news article


