
Compare NexTone, Inc. with Similar Stocks
Dashboard
1
High Management Efficiency with a high ROE of 14.48%
2
Company has very low debt and has enough cash to service the debt requirements
3
Healthy long term growth as Net Sales has grown by an annual rate of 33.44% and Operating profit at 16.86%
4
The company has declared Positive results for the last 4 consecutive quarters
5
With ROE of 13.64%, it has a expensive valuation with a 4.50 Price to Book Value
Stock DNA
Media & Entertainment
JPY 17,814 Million (Small Cap)
33.00
NA
0.00%
-1.87
16.27%
3.46
Revenue and Profits:
Net Sales:
5,361 Million
(Quarterly Results - Jun 2025)
Net Profit:
222 Million
Total Returns (Price + Dividend) 
TimePeriod
Price Return
Dividend Return
Total Return
3 Months
44.09%
0%
44.09%
6 Months
25.15%
0%
25.15%
1 Year
11.74%
0%
11.74%
2 Years
-22.86%
0%
-22.86%
3 Years
-52.19%
0%
-52.19%
4 Years
-46.0%
0%
-46.0%
5 Years
-43.98%
0%
-43.98%
NexTone, Inc. for the last several years.
Risk Adjusted Returns v/s
News
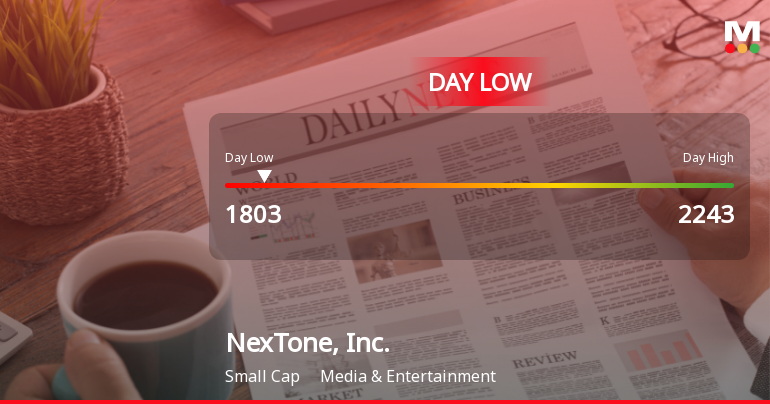
NexTone, Inc. Hits Day Low of JPY 1,803 Amid Price Pressure
NexTone, Inc. faced a notable stock decline today, reflecting ongoing challenges in the short term. Despite recent fluctuations, the company has shown strong year-to-date performance and solid fundamentals, including healthy ROE and net sales growth, alongside low debt levels and adequate cash reserves for operational stability.
Read full news article Announcements

No announcement available
Corporate Actions
No corporate action available
Quality key factors
Factor
Value
Sales Growth (5y)
33.44%
EBIT Growth (5y)
16.86%
EBIT to Interest (avg)
100.00
Debt to EBITDA (avg)
Negative Net Debt
Net Debt to Equity (avg)
-2.02
Sales to Capital Employed (avg)
3.52
Tax Ratio
38.77%
Dividend Payout Ratio
0
Pledged Shares
0
Institutional Holding
0
ROCE (avg)
0
ROE (avg)
14.48%
Valuation key factors
Factor
Value
P/E Ratio
33
Industry P/E
Price to Book Value
4.50
EV to EBIT
11.71
EV to EBITDA
6.42
EV to Capital Employed
-2.42
EV to Sales
0.61
PEG Ratio
0.55
Dividend Yield
NA
ROCE (Latest)
Negative Capital Employed
ROE (Latest)
13.64%
Technicals key factors
Indicator
Weekly
Monthly
MACD
Bearish
Mildly Bullish
RSI
No Signal
No Signal
Bollinger Bands
Bearish
Bearish
Moving Averages
Bearish (Daily)
KST
Bearish
Bullish
Dow Theory
Mildly Bearish
No Trend
OBV
Mildly Bearish
No Trend
 Technical Indicator Scale: Bearish, Mildly Bearish, Sideways, Mildly Bullish, Bullish Turned
 Shareholding Snapshot
No data for shareholding present.
Shareholding Compare (%holding)
No data for shareholding present.
Quarterly Results Snapshot (Consolidated) - Jun'25 - QoQ
Jun'25
Mar'25
Change(%)
Net Sales
5,361.00
5,160.00
3.90%
Operating Profit (PBDIT) excl Other Income
421.00
912.00
-53.84%
Interest
0.00
0.00
Exceptional Items
0.00
-119.00
100.00%
Consolidate Net Profit
222.00
268.00
-17.16%
Operating Profit Margin (Excl OI)
60.80%
82.40%
-2.16%
USD in Million.

Net Sales
QoQ Growth in quarter ended Jun 2025 is 3.90% vs 6.68% in Mar 2025
Consolidated Net Profit
QoQ Growth in quarter ended Jun 2025 is -17.16% vs 235.00% in Mar 2025
Annual Results Snapshot (Consolidated) - Mar'25
Mar'25
Mar'24
Change(%)
Net Sales
19,412.00
13,433.00
44.51%
Operating Profit (PBDIT) excl Other Income
1,737.00
1,120.00
55.09%
Interest
0.00
0.00
Exceptional Items
-109.00
33.00
-430.30%
Consolidate Net Profit
547.00
430.00
27.21%
Operating Profit Margin (Excl OI)
51.80%
48.40%
0.34%
USD in Million.
Net Sales
YoY Growth in year ended Mar 2025 is 44.51% vs 52.39% in Mar 2024

Consolidated Net Profit
YoY Growth in year ended Mar 2025 is 27.21% vs -31.89% in Mar 2024
About NexTone, Inc.

NexTone, Inc.
Media & Entertainment
No Details Available.
Company Coordinates
No Company Details Available
InfinHub Market Technologies FZ-LLC, Building-2, Unit 112, Dubai Internet City, Dubai, United Arab Emirates
GET THE MARKETSMOJO APP


Company
Stocks
Portfolio


"Investment in securities markets are subject to market risk. Read all the related documents carefully before investing."