
Compare NHC Foods with Similar Stocks
Dashboard
Weak Long Term Fundamental Strength with an average Return on Capital Employed (ROCE) of 8.44%
With a growth in Net Profit of 151.32%, the company declared Outstanding results in Mar 26
With ROCE of 8.4, it has a Attractive valuation with a 0.6 Enterprise value to Capital Employed
Majority shareholders : Non Institution
Market Beating Performance
Total Returns (Price + Dividend) 
NHC Foods for the last several years.
Risk Adjusted Returns v/s
Returns Beta

News
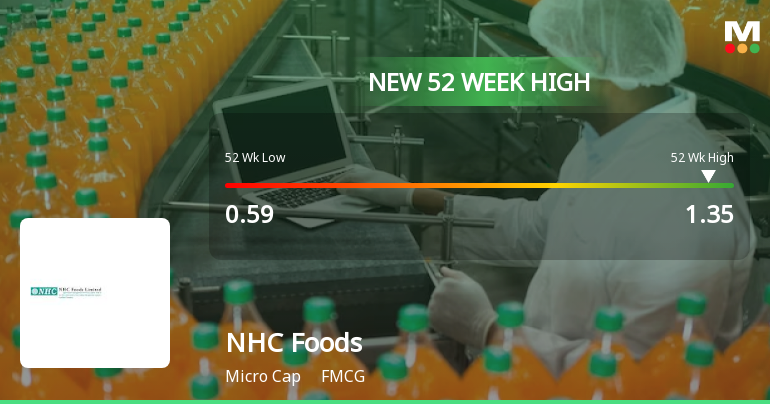
Broad-Based Technical Strength Lifts NHC Foods Ltd to 52-Week High of Rs 1.35
Surging to a new 52-week high of Rs 1.35 on 09 Jun 2026, NHC Foods Ltd has demonstrated robust price momentum, outpacing the broader market with a 37.5% gain over the past year compared to the Sensex’s 10.42% decline. This milestone reflects a confluence of bullish technical indicators and sustained upward price action despite a cautious market backdrop.
Read full news article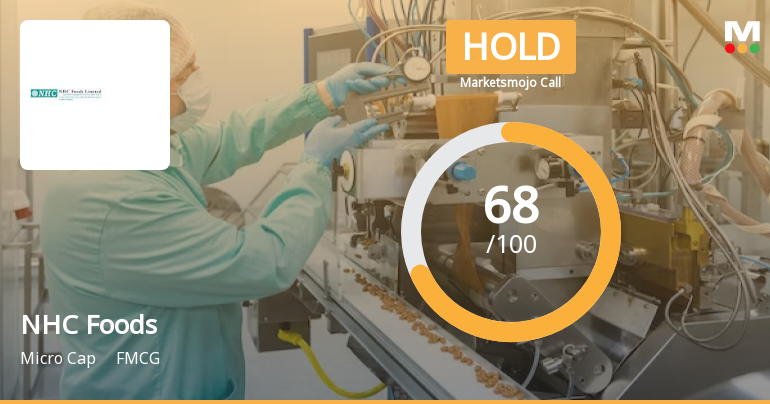
NHC Foods Ltd Upgraded to Hold by MarketsMOJO on Improved Fundamentals and Technicals
NHC Foods Ltd, a micro-cap player in the FMCG sector, has seen its investment rating upgraded from Sell to Hold as of 8 June 2026. This change reflects significant improvements across technical indicators and valuation metrics, alongside steady financial trends, signalling a cautious but optimistic outlook for investors.
Read full news article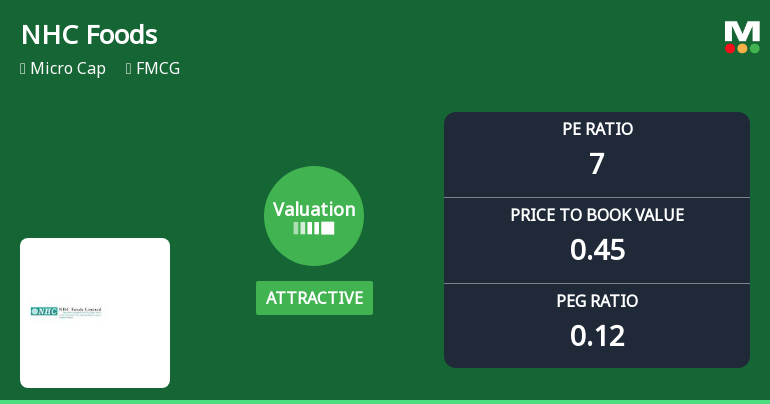
NHC Foods Ltd Valuation Shifts Signal Renewed Price Attractiveness Amid Mixed Market Returns
NHC Foods Ltd has recently undergone a notable shift in its valuation parameters, moving from a very attractive to an attractive rating. This change, coupled with its micro-cap status and recent price movements, offers investors a nuanced perspective on the stock’s price attractiveness relative to its historical averages and peer group within the FMCG sector.
Read full news article Announcements
Revised Outcome Of Board Meeting Dated June 1 2026
04-Jun-2026 | Source : BSERevised outcome of Board Meeting dated June 1 2026 is enclosed
Board Meeting Outcome for Intimation Under Regulation 30 Of SEBI (Listing Obligations And Disclosures Requirements) Regulations 2015 (SEBI Listing Regulations) -Investment In Wholly Owned Subsidiary
01-Jun-2026 | Source : BSEIntimation under Regulation 30 of SEBI (Listing Obligations and Disclosures Requirements) Regulations 2015 (SEBI Listing Regulations) -Investment in Wholly Owned Subsidiary
Compliances-Reg.24(A)-Annual Secretarial Compliance
30-May-2026 | Source : BSEAnnual Secretarial Compliance Report for the year ended March 2026
Corporate Actions

No Upcoming Board Meetings

No Dividend history available

NHC Foods Ltd has announced 1:10 stock split, ex-date: 22 Jul 24

No Bonus history available

NHC Foods Ltd has announced 4:1 rights issue, ex-date: 26 Nov 24
Quality key factors
Valuation key factors
Technicals key factors
 Technical Indicator Scale: Bearish, Mildly Bearish, Sideways, Mildly Bullish, Bullish Turned
 Shareholding Snapshot : Mar 2026
Shareholding Compare (%holding)
Non Institution
None
Held by 0 Schemes
Held by 0 FIIs
None
Satyam Shirishchandra Joshi (13.83%)
69.76%
Quarterly Results Snapshot (Consolidated) - Mar'26 - QoQ

QoQ Growth in quarter ended Mar 2026 is 100.02% vs 25.17% in Dec 2025
QoQ Growth in quarter ended Mar 2026 is 150.98% vs 96.15% in Dec 2025
Half Yearly Results Snapshot (Standalone) - Sep'25

Growth in half year ended Sep 2025 is 60.07% vs 60.17% in Sep 2024
Growth in half year ended Sep 2025 is -18.38% vs 340.48% in Sep 2024
Nine Monthly Results Snapshot (Standalone) - Dec'25
YoY Growth in nine months ended Dec 2025 is 59.84% vs 59.51% in Dec 2024
YoY Growth in nine months ended Dec 2025 is -15.37% vs 355.91% in Dec 2024
Annual Results Snapshot (Consolidated) - Mar'26
YoY Growth in year ended Mar 2026 is 72.85% vs 66.26% in Mar 2025
YoY Growth in year ended Mar 2026 is 74.01% vs 189.79% in Mar 2025
About NHC Foods Ltd

Company Coordinates


