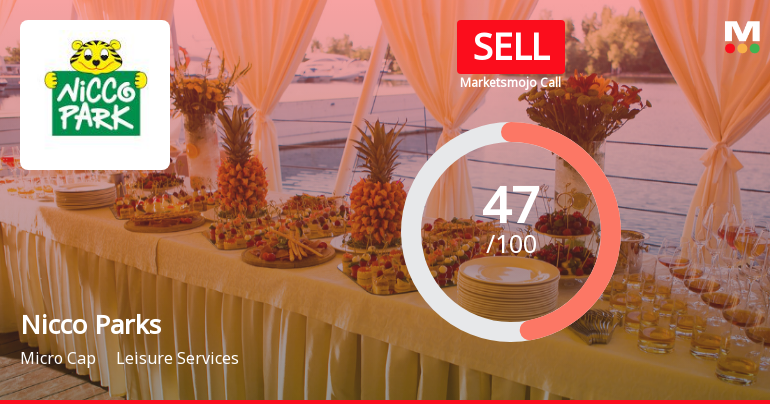
Nicco Parks

  • Market Cap: Micro Cap
  • Industry: Leisure Services
  • ISIN: INE653C01022
  • NSEID: NICCOPAR
  • BSEID: 526721
INR
85.51
0.00 (0.00%)
BSENSE

Aug 31, 03:30 PM

BSE+NSE Vol: 234

  • Price Points
  • Score
  • Mojo Parameters
  • Total Return
  • News and Corporate Actions
  • Key factors
  • Shareholding
  • Financials
  • CompanyCV
stock-summaryPrice Point
High/Low

1Day

52 Week

Valuation
Technical
Day's Volume

CASH

234 (-94.57%) Volume

Shareholding (Jun 2026)

FII

0.00%

Held by 0 FIIs

DII

0.00%

Held by 0 DIIs

Promoter

69.57%

Why is Nicco Parks & Resorts Ltd falling/rising?

01-Sep-2026

As of 31-Aug, Nicco Parks & Resorts Ltd's stock price is at 87.00, reflecting a 0.24% increase. The stock has outperformed the benchmark Sensex recently, showing strong gains over the past week and month, while trading above key moving averages despite a slight decline in investor participation.

As of 31-Aug, Nicco Parks & Resorts Ltd's stock price is rising, currently at 87.00, with a change of 0.21 (0.24%) upward. The stock has shown strong performance over the past week, increasing by 5.45%, while the benchmark Sensex has decreased by 0.53%. Over the past month, the stock has risen by 19.00%, contrasting with a decline of 1.46% in the Sensex. <BR><BR>Additionally, the stock is trading above its 5-day, 20-day, 50-day, 100-day, and 200-day moving averages, indicating a positive trend in its price movement. Despite a decrease in investor participation, with delivery volume falling by 7.95% against the 5-day average, the stock remains liquid enough for trading. Overall, the combination of strong recent performance relative to the market and favorable moving averages contributes to the upward movement in Nicco Parks & Resorts Ltd's stock price.

View full answer

Who are in the management team of Nicco Parks?

01-Sep-2026

The management team of Nicco Parks includes Chairperson Nandini Chakravorty, Managing Director & CEO Rajesh Raisinghani, and several independent directors, along with company secretary Rahul Mitra and non-executive director Ramapadhran Arjun. They oversee the company's operations and strategic direction.

The management team of Nicco Parks includes the following individuals:<BR><BR>1. **Nandini Chakravorty** - Chairperson<BR>2. **Rajesh Raisinghani** - Managing Director & CEO<BR>3. **Rahul Mitra** - Company Secretary & Compliance Officer<BR>4. **Sujit Poddar** - Independent Director<BR>5. **Anand Chatrath** - Independent Director<BR>6. **Tapan Chaki** - Independent Director<BR>7. **Dipankar Chatterji** - Independent Director<BR>8. **Vijay Dewan** - Independent Director<BR>9. **Nayantara Palchoudhuri** - Independent Director<BR>10. **Vandana Yadav** - Nominee<BR>11. **Ashok Banerjee** - Nominee<BR>12. **Ramapadhran Arjun** - Non-Executive Director<BR><BR>This team is responsible for overseeing the operations and strategic direction of Nicco Parks.

View full answer

What does Nicco Parks do?

01-Sep-2026

Nicco Parks & Resorts Ltd operates amusement parks and is classified as a micro-cap company, with recent net sales of 19 Cr and a net profit of 5 Cr as of June 2026. It was established in 1989 as a joint venture between the private sector and the Government of West Bengal.

Overview:<BR>Nicco Parks & Resorts Ltd operates in the leisure services industry, focusing on amusement park operations and is classified as a micro-cap company.<BR><BR>History:<BR>The company was incorporated on March 17, 1989, as a Joint Sector Company involving the private sector and the Government of West Bengal. The latest quarterly results reported net sales and profit for June 2026.<BR><BR>Financial Snapshot:<BR>Most recent Net Sales: 19 Cr (Quarterly Results - Jun 2026) <BR>Most recent Net Profit: 5 Cr (Quarterly Results - Jun 2026) <BR>Market-cap value: INR 417 Cr (Micro Cap)<BR><BR>Key Metrics:<BR>P/E: 69.00 <BR>Industry P/E: 41 <BR>Dividend Yield: 0.58% <BR>Debt Equity: -0.61 <BR>Return on Equity: 10.88% <BR>Price to Book: 3.85 <BR><BR>Contact Details:<BR>Address: Jheel Meel Sector IV, Salt Lake City Kolkata West Bengal : 700106 <BR>Phone: 91-33-66285549/66285509 <BR>Email: niccopark@niccoparks.com <BR>Website: http://www.niccoparks.com

View full answer

Who are the peers of the Nicco Parks?

01-Sep-2026

Nicco Parks' peers include United Foodbrand, Delta Corp, Speciality Restaurants, Coffee Day Enterprises, Kaya Ltd, Gourmet Gateway, Vikram Kamats, Pecos Hotels, and Ajwa Fun World. Nicco Parks has a 1-year return of -15.41%, better than Coffee Day Enterprises but lower than its other peers, with varying management risks and growth rates among them.

Peers: The peers of Nicco Parks are United Foodbrand, Delta Corp, Speciality Rest., Coffee Day Enter, Kaya Ltd, Gourmet Gateway, Vikram Kamats, Pecos Hotels, and Ajwa Fun World.<BR><BR>Quality Snapshot: Excellent management risk is observed at Nicco Parks and Pecos Hotels, while Average management risk is found at Delta Corp, Speciality Rest., and Vikram Kamats, and the rest have Below Average management risk. Growth is Good at Vikram Kamats and Pecos Hotels, Average at Delta Corp and Speciality Rest., and Below Average at Nicco Parks, United Foodbrand, Coffee Day Enter, Kaya Ltd, and Gourmet Gateway. Excellent capital structure is noted at Nicco Parks and Gourmet Gateway, Good at Speciality Rest. and Pecos Hotels, and Below Average at United Foodbrand, Delta Corp, Coffee Day Enter, Kaya Ltd, and Vikram Kamats.<BR><BR>Return Snapshot: The peer with the highest 1-year return is United Foodbrand at 171.12%, while Coffee Day Enter has the lowest at -40.92%. Nicco Parks has a 1-year return of -15.41%, which is higher than Coffee Day Enter but lower than all other peers. Additionally, Delta Corp, Vikram Kamats, and Ajwa Fun World have negative six-month returns.

View full answer

How big is Nicco Parks?

01-Sep-2026

As of 31st August, Nicco Parks & Resorts Ltd has a market capitalization of 417.00 Cr, with recent Net Sales of 59.10 Cr and a Net Profit of 5.91 Cr. Shareholder's Funds are 104.60 Cr and Total Assets are 136.15 Cr as of March 2026.

As of 31st August, Nicco Parks & Resorts Ltd has a market capitalization of 417.00 Cr, categorizing it as a Micro Cap company.<BR><BR>In the latest four quarters, the company reported Net Sales of 59.10 Cr and a Net Profit of 5.91 Cr.<BR><BR>For the latest annual period ending in March 2026, the Shareholder's Funds amounted to 104.60 Cr, while Total Assets were reported at 136.15 Cr.

View full answer

Should I buy, sell or hold Nicco Parks & Resorts Ltd?

25-Aug-2026

When is the next results date for Nicco Parks & Resorts Ltd?

06-Aug-2026

The next results date for Nicco Parks & Resorts Ltd is 13 August 2026.

The next results date for Nicco Parks & Resorts Ltd is scheduled for 13 August 2026.

View full answer

Are Nicco Parks & Resorts Ltd latest results good or bad?

16-May-2026

Nicco Parks & Resorts Ltd's latest results are concerning, with a net loss of ₹0.72 crores in Q4 FY26, a 121.43% decline year-on-year, and a 12.73% drop in revenue to ₹15.35 crores. The company's operating margins have collapsed to -1.17%, indicating significant operational challenges and a negative outlook for investors.

The latest results for Nicco Parks & Resorts Ltd are quite concerning. In the fourth quarter of FY26, the company reported a net loss of ₹0.72 crores, which represents a staggering decline of 121.43% year-on-year. This is a significant deterioration compared to the previous year when the company was still profitable.<BR><BR>Revenue also fell by 12.73% year-on-year to ₹15.35 crores, despite a sequential improvement from the previous quarter. Operating margins collapsed to -1.17%, down from a healthy 22.29% in the same quarter last year. This indicates severe operational stress and raises questions about the sustainability of the business model.<BR><BR>The overall financial performance reflects a troubling trend, with elevated employee costs consuming a larger portion of revenues, further complicating the company's ability to generate profits. The stock has faced significant selling pressure, trading down 4.62% on the day of the results and currently sitting 43.11% below its 52-week high.<BR><BR>Given these results, it is clear that Nicco Parks is facing serious challenges, and the outlook appears negative. Investors should be cautious, as the combination of losses, declining revenues, and collapsing margins suggests a difficult road ahead for the company.

View full answer

How has been the historical performance of Nicco Parks?

13-Nov-2025

Nicco Parks has experienced fluctuating financial performance, with net sales declining from INR 79.33 crore in March 2024 to INR 75.02 crore in March 2025, alongside decreases in operating profit and profit before tax. However, total assets increased to INR 136.37 crore in March 2025, indicating some growth despite overall challenges.

Answer:<BR>The historical performance of Nicco Parks shows a fluctuating trend in its financial metrics over the years.<BR><BR>Breakdown:<BR>Nicco Parks' net sales have seen a decline from INR 79.33 crore in March 2024 to INR 75.02 crore in March 2025, following a peak of INR 76.63 crore in March 2023. The total operating income mirrored this trend, decreasing from INR 79.33 crore in March 2024 to INR 75.02 crore in March 2025. The company experienced an operating profit (PBDIT) of INR 26.34 crore in March 2025, down from INR 31.36 crore in the previous year, while the profit before tax also dropped to INR 24.73 crore from INR 28.76 crore. The profit after tax for March 2025 was INR 18.14 crore, slightly lower than INR 19.73 crore in March 2024. The earnings per share (EPS) decreased to INR 4.79 from INR 5.29. On the balance sheet, total assets increased to INR 136.37 crore in March 2025 from INR 122.36 crore in March 2024, with total liabilities also rising to INR 136.37 crore from INR 122.36 crore. The cash flow from operating activities decreased to INR 16 crore in March 2025 from INR 20 crore in March 2024, while the closing cash and cash equivalents increased to INR 5 crore from INR 2 crore. Overall, the financial performance of Nicco Parks reflects a mix of challenges and growth in certain areas over the reported years.

View full answer

Is Nicco Parks technically bullish or bearish?

29-Jul-2025

As of July 28, 2025, Nicco Parks shows a mildly bearish trend, with daily moving averages indicating bearish sentiment, while weekly indicators suggest a mixed outlook, leading to a neutral short-term stance.

As of 28 July 2025, the technical trend for Nicco Parks has changed from bearish to mildly bearish. The current stance is mildly bearish, driven by the daily moving averages indicating a bearish sentiment and the weekly Bollinger Bands also showing a mildly bearish trend. While the weekly MACD and KST are mildly bullish, the overall monthly indicators, including MACD and Bollinger Bands, remain bearish. The Dow Theory suggests a mildly bullish outlook on the weekly timeframe but is mildly bearish on the monthly. The lack of clear signals from the RSI further supports a neutral stance in the short term.

View full answer

Is Nicco Parks overvalued or undervalued?

09-Jun-2025

As of February 14, 2022, Nicco Parks is considered very expensive and overvalued, with a PE ratio of 25.04 and a year-to-date decline of 12.34%, indicating a significant shift in market perception despite its historical strong returns.

As of 14 February 2022, the valuation grade for Nicco Parks moved from risky to very expensive, indicating a significant shift in its market perception. The company is currently overvalued, as reflected in its key ratios: a PE ratio of 25.04, an EV to EBITDA of 22.64, and a Price to Book Value of 5.14. These figures suggest that investors are paying a premium for the stock relative to its earnings and book value.<BR><BR>In comparison to its peers, Nicco Parks stands out with a higher PE ratio than the industry average, which typically ranges lower, and its PEG ratio of 0.00 indicates no growth expectations priced in. Notably, while the company has shown strong returns over the long term, its recent performance has lagged behind the Sensex, with a year-to-date decline of 12.34% compared to the Sensex's gain of 5.62%. This further reinforces the notion that the stock is currently overvalued.

View full answer

Who are the top shareholders of the Nicco Parks?

06-Jun-2025

The top shareholders of Nicco Parks are the Bandhan Employees Welfare Trust with 20.0% and Deepak Bhagnani, the largest public shareholder, with 9.85%. Individual investors own a total of 25.12%, with no mutual funds or foreign institutional investors currently holding shares.

The top shareholders of Nicco Parks include the Bandhan Employees Welfare Trust, which holds the largest stake at 20.0%. Additionally, Deepak Bhagnani is the highest public shareholder with a holding of 9.85%. Overall, individual investors collectively own 25.12% of the company. There are no mutual funds or foreign institutional investors currently holding shares in Nicco Parks.

View full answer

Has Nicco Parks declared dividend?

06-Jun-2025

Nicco Parks & Resorts Ltd has declared a 40% dividend, amounting to ₹0.25 per share, with an ex-date of June 6, 2025. While recent returns have been negative, the company has shown substantial long-term growth, with a total return of 306.81% over the past five years.

Nicco Parks & Resorts Ltd has declared a 40% dividend.<BR><BR>Dividend Details:<BR>- Percentage announced: 40%<BR>- Amount per share: 0.25<BR>- Ex-date: 06 Jun 25<BR><BR>Dividend Yield: 0.69%.<BR><BR>Total Returns by Period:<BR>In the last 6 months, the price return was -12.81%, the dividend return was 0.48%, resulting in a total return of -12.33%.<BR><BR>Over the past year, the price return was -22.69%, the dividend return was 0.82%, leading to a total return of -21.87%.<BR><BR>In the 2-year period, the price return was -18.77%, the dividend return was 2.03%, culminating in a total return of -16.74%.<BR><BR>For the 3-year period, the price return was 81.36%, the dividend return was 5.46%, resulting in a total return of 86.82%.<BR><BR>In the last 4 years, the price return was 173.72%, the dividend return was 9.06%, leading to a total return of 182.78%.<BR><BR>Over the 5-year period, the price return was 293.65%, the dividend return was 13.16%, culminating in a total return of 306.81%.<BR><BR>Overall, Nicco Parks & Resorts Ltd has declared a significant dividend, and while recent returns have been negative in shorter periods, the long-term performance shows substantial growth in total returns, indicating a positive trend for investors.

View full answer
iScoreScore
Click here to find our call on this stock
Strong Sell
Sell
Hold
Buy
Strong Buy

Dashboard

1

Poor long term growth as Operating profit has grown by an annual rate 18.87% of over the last 5 years

 
2

With a fall in Net Sales of -27.54%, the company declared Very Negative results in Jun 26

3

With ROE of 10.9, it has a Very Expensive valuation with a 3.9 Price to Book Value

stock-summaryMojo Parameters

Mojo Parameters

Loading Valuation Snapshot...

Stock DNA

stock-summary
Industry

Leisure Services

stock-summary
Market cap

INR Cr (Micro Cap)

stock-summary
P/E

69.00

stock-summary
Industry P/E

NA

stock-summary
Dividend Yield

0.00%

stock-summary
Debt Equity

0.00

stock-summary
Return on Equity

0.00%

stock-summary
Price to Book

0.00

Revenue and Profits:
Net Sales:
19 Cr
(Quarterly Results - Jun 2026)
Net Profit:
5 Cr
stock-summaryTotal Returns
Total Returns (Price + Dividend) stock-summary
Icon
Company does not have enough history
Risk Adjusted Returns v/s stock-summary
Returns Beta
Icon
Beta has not been calculated since enough price history is not available
stock-summaryNews & Corporate Actions

News

stock-summaryKey Factors

Quality key factors stock-summary

Factor
Value
Sales Growth (5y)
26.73%
EBIT Growth (5y)
18.87%
EBIT to Interest (avg)
18.02
Debt to EBITDA (avg)
Negative Net Debt
Net Debt to Equity (avg)
-0.61
Sales to Capital Employed (avg)
0.74
Tax Ratio
24.90%
Dividend Payout Ratio
-214.61%
Pledged Shares
0
Institutional Holding
0.00%
ROCE (avg)
42.02%
ROE (avg)
19.29%

Valuation key factors

Factor
Value
P/E Ratio
69
Industry P/E
21
Price to Book Value
3.89
EV to EBIT
158.46
EV to EBITDA
66.13
EV to Capital Employed
8.33
EV to Sales
5.82
PEG Ratio
NA
Dividend Yield
0.57%
ROCE (Latest)
18.53%
ROE (Latest)
10.88%

Technicals key factors

Indicator
Weekly
Monthly
MACD
Bullish
Mildly Bullish
RSI
No Signal
No Signal
Bollinger Bands
Bullish
Mildly Bearish
Moving Averages
Bullish (Daily)
KST
Bullish
Bearish
Dow Theory
No Trend
Mildly Bullish
OBV
Bullish
No Trend
stock-summary Technical Indicator Scale: Bearish, Mildly Bearish, Sideways, Mildly Bullish, Bullish  Turned 
stock-summaryShareholding
Shareholding Snapshot : Jun 2026stock-summary
Shareholding Compare (%holding) stock-summary
Majority shareholders

Promoters

Pledged Promoter Holdings

None

Mutual Funds

Held by 0 Schemes

FIIs

Held by 0 FIIs

Promoter with highest holding

Bandhan Employees Welfare Trust (trustee : Ronendra Chowdhury, Rama Prasad Mohanta, Alok Dutta, Subo (20.0%)

Highest Public shareholder

Deepak Bhagnani (9.85%)

Individual Investors Holdings

24.82%

stock-summaryFinancial
[
  {
    "link": "quarterly",
    "btn_text": "All Quarterly Results",
    "header": "Quarterly Results Snapshot (Consolidated) - Jun'26 - YoY",
    "rhs": [
      {
        "prefix": "Net Sales ",
        "suffix": "YoY Growth in quarter ended Jun 2026 is -27.54% vs 6.27% in Jun 2025",
        "dir": -1
      },
      {
        "prefix": "Consolidated Net Profit ",
        "suffix": "YoY Growth in quarter ended Jun 2026 is 273.10% vs -135.95% in Jun 2025",
        "dir": 1
      }
    ],
    "table": {
      "header": [
        "Jun'26",
        "Jun'25",
        "Change(%)"
      ],
      "body": [
        {
          "field": "Net Sales",
          "val1": "19.05",
          "val2": "26.29",
          "chgp": "-27.54%",
          "chgp_class": "negative"
        },
        {
          "field": "Operating Profit (PBDIT) excl Other Income",
          "val1": "5.87",
          "val2": "11.11",
          "chgp": "-47.16%",
          "chgp_class": "negative"
        },
        {
          "field": "Interest",
          "val1": "0.00",
          "val2": "0.00",
          "chgp": "",
          "chgp_class": "neutral"
        },
        {
          "field": "Exceptional Items",
          "val1": "0.00",
          "val2": "-14.10",
          "chgp": "100.00%",
          "chgp_class": "positive"
        },
        {
          "field": "Consolidate Net Profit",
          "val1": "5.47",
          "val2": "-3.16",
          "chgp": "273.10%",
          "chgp_class": "positive"
        },
        {
          "field": "Operating Profit Margin (Excl OI)",
          "val1": "30.81%",
          "val2": "42.26%",
          "chgp": "-11.45%",
          "chgp_class": "negative"
        }
      ]
    }
  },
  {
    "link": "half-yearly",
    "btn_text": "All Half Yearly Results",
    "header": "Half Yearly Results Snapshot (Consolidated) - Sep'25",
    "rhs": [
      {
        "prefix": "Net Sales ",
        "suffix": " Growth in half year ended Sep 2025 is -1.87% vs -11.35% in Sep 2024",
        "dir": 1
      },
      {
        "prefix": "Consolidated Net Profit ",
        "suffix": " Growth in half year ended Sep 2025 is -120.53% vs -8.90% in Sep 2024",
        "dir": -1
      }
    ],
    "table": {
      "header": [
        "Sep'25",
        "Sep'24",
        "Change(%)"
      ],
      "body": [
        {
          "field": "Net Sales",
          "val1": "37.80",
          "val2": "38.52",
          "chgp": "-1.87%",
          "chgp_class": "negative"
        },
        {
          "field": "Operating Profit (PBDIT) excl Other Income",
          "val1": "10.87",
          "val2": "12.68",
          "chgp": "-14.27%",
          "chgp_class": "negative"
        },
        {
          "field": "Interest",
          "val1": "0.00",
          "val2": "0.01",
          "chgp": "-100.00%",
          "chgp_class": "positive"
        },
        {
          "field": "Exceptional Items",
          "val1": "-14.10",
          "val2": "0.00",
          "chgp": "",
          "chgp_class": "neutral"
        },
        {
          "field": "Consolidate Net Profit",
          "val1": "-2.92",
          "val2": "14.22",
          "chgp": "-120.53%",
          "chgp_class": "negative"
        },
        {
          "field": "Operating Profit Margin (Excl OI)",
          "val1": "28.76%",
          "val2": "32.92%",
          "chgp": "-4.16%",
          "chgp_class": "negative"
        }
      ]
    }
  },
  {
    "link": "nine-monthly",
    "btn_text": "All Nine Monthly Results",
    "header": "Nine Monthly Results Snapshot (Consolidated) - Dec'25",
    "rhs": [
      {
        "prefix": "Net Sales ",
        "suffix": "YoY Growth in nine months ended Dec 2025 is -11.20% vs -5.87% in Dec 2024",
        "dir": -1
      },
      {
        "prefix": "Consolidated Net Profit ",
        "suffix": "YoY Growth in nine months ended Dec 2025 is -110.48% vs -3.73% in Dec 2024",
        "dir": -1
      }
    ],
    "table": {
      "header": [
        "Dec'25",
        "Dec'24",
        "Change(%)"
      ],
      "body": [
        {
          "field": "Net Sales",
          "val1": "51.00",
          "val2": "57.43",
          "chgp": "-11.20%",
          "chgp_class": "negative"
        },
        {
          "field": "Operating Profit (PBDIT) excl Other Income",
          "val1": "10.62",
          "val2": "17.78",
          "chgp": "-40.27%",
          "chgp_class": "negative"
        },
        {
          "field": "Interest",
          "val1": "0.00",
          "val2": "0.03",
          "chgp": "-100.00%",
          "chgp_class": "positive"
        },
        {
          "field": "Exceptional Items",
          "val1": "-14.10",
          "val2": "0.00",
          "chgp": "",
          "chgp_class": "neutral"
        },
        {
          "field": "Consolidate Net Profit",
          "val1": "-2.00",
          "val2": "19.08",
          "chgp": "-110.48%",
          "chgp_class": "negative"
        },
        {
          "field": "Operating Profit Margin (Excl OI)",
          "val1": "20.82%",
          "val2": "30.96%",
          "chgp": "-10.14%",
          "chgp_class": "negative"
        }
      ]
    }
  },
  {
    "link": "annual",
    "btn_text": "All Annual Results",
    "header": "Annual Results Snapshot (Consolidated) - Mar'26",
    "rhs": [
      {
        "prefix": "Net Sales ",
        "suffix": "YoY Growth in year ended Mar 2026 is -11.56% vs -5.43% in Mar 2025",
        "dir": -1
      },
      {
        "prefix": "Consolidated Net Profit ",
        "suffix": "YoY Growth in year ended Mar 2026 is -112.17% vs -9.37% in Mar 2025",
        "dir": -1
      }
    ],
    "table": {
      "header": [
        "Mar'26",
        "Mar'25",
        "Change(%)"
      ],
      "body": [
        {
          "field": "Net Sales",
          "val1": "66.35",
          "val2": "75.02",
          "chgp": "-11.56%",
          "chgp_class": "negative"
        },
        {
          "field": "Operating Profit (PBDIT) excl Other Income",
          "val1": "10.44",
          "val2": "21.70",
          "chgp": "-51.89%",
          "chgp_class": "negative"
        },
        {
          "field": "Interest",
          "val1": "0.00",
          "val2": "0.03",
          "chgp": "-100.00%",
          "chgp_class": "positive"
        },
        {
          "field": "Exceptional Items",
          "val1": "-14.10",
          "val2": "0.81",
          "chgp": "-1,840.74%",
          "chgp_class": "negative"
        },
        {
          "field": "Consolidate Net Profit",
          "val1": "-2.73",
          "val2": "22.44",
          "chgp": "-112.17%",
          "chgp_class": "negative"
        },
        {
          "field": "Operating Profit Margin (Excl OI)",
          "val1": "15.73%",
          "val2": "28.93%",
          "chgp": "-13.20%",
          "chgp_class": "negative"
        }
      ]
    }
  }
]

Quarterly Results Snapshot (Consolidated) - Jun'26 - YoYstock-summary

Jun'26
Jun'25
Change(%)
Net Sales
19.05
26.29
-27.54%
Operating Profit (PBDIT) excl Other Income
5.87
11.11
-47.16%
Interest
0.00
0.00
Exceptional Items
0.00
-14.10
100.00%
Consolidate Net Profit
5.47
-3.16
273.10%
Operating Profit Margin (Excl OI)
30.81%
42.26%
-11.45%
Values in Rs Cr.
Direction Arrows
Net Sales

YoY Growth in quarter ended Jun 2026 is -27.54% vs 6.27% in Jun 2025

Direction Arrows
Consolidated Net Profit

YoY Growth in quarter ended Jun 2026 is 273.10% vs -135.95% in Jun 2025

Half Yearly Results Snapshot (Consolidated) - Sep'25stock-summary

Sep'25
Sep'24
Change(%)
Net Sales
37.80
38.52
-1.87%
Operating Profit (PBDIT) excl Other Income
10.87
12.68
-14.27%
Interest
0.00
0.01
-100.00%
Exceptional Items
-14.10
0.00
Consolidate Net Profit
-2.92
14.22
-120.53%
Operating Profit Margin (Excl OI)
28.76%
32.92%
-4.16%
Values in Rs Cr.
Direction Arrows
Net Sales

Growth in half year ended Sep 2025 is -1.87% vs -11.35% in Sep 2024

Direction Arrows
Consolidated Net Profit

Growth in half year ended Sep 2025 is -120.53% vs -8.90% in Sep 2024

Nine Monthly Results Snapshot (Consolidated) - Dec'25stock-summary

Dec'25
Dec'24
Change(%)
Net Sales
51.00
57.43
-11.20%
Operating Profit (PBDIT) excl Other Income
10.62
17.78
-40.27%
Interest
0.00
0.03
-100.00%
Exceptional Items
-14.10
0.00
Consolidate Net Profit
-2.00
19.08
-110.48%
Operating Profit Margin (Excl OI)
20.82%
30.96%
-10.14%
Values in Rs Cr.
Direction Arrows
Net Sales

YoY Growth in nine months ended Dec 2025 is -11.20% vs -5.87% in Dec 2024

Direction Arrows
Consolidated Net Profit

YoY Growth in nine months ended Dec 2025 is -110.48% vs -3.73% in Dec 2024

Annual Results Snapshot (Consolidated) - Mar'26stock-summary

Mar'26
Mar'25
Change(%)
Net Sales
66.35
75.02
-11.56%
Operating Profit (PBDIT) excl Other Income
10.44
21.70
-51.89%
Interest
0.00
0.03
-100.00%
Exceptional Items
-14.10
0.81
-1,840.74%
Consolidate Net Profit
-2.73
22.44
-112.17%
Operating Profit Margin (Excl OI)
15.73%
28.93%
-13.20%
Values in Rs Cr.
Direction Arrows
Net Sales

YoY Growth in year ended Mar 2026 is -11.56% vs -5.43% in Mar 2025

Direction Arrows
Consolidated Net Profit

YoY Growth in year ended Mar 2026 is -112.17% vs -9.37% in Mar 2025

stock-summaryCompany CV
About Nicco Parks & Resorts Ltd stock-summary
stock-summary
Nicco Parks & Resorts Ltd
Micro Cap
Leisure Services
Nicco Parks & Resorts Limited (NPRL), was incorporated on March 17, 1989 as a Joint Sector Company with National Insulated Cable Co., Ltd. (now known Nicco Corporation Ltd.,) from the private sector and the Government of West Bengal (GoWB) represented by West Bengal Industrial Development Corporation Limited (WBIDC) and West Bengal Tourism Development Corporation Limited (WBTDC) to set up an Amusement Park on the outskirts of Calcutta.
Company Coordinates stock-summary
Company Details
Jheel Meel Sector IV, Salt Lake City Kolkata West Bengal : 700106
stock-summary
Tel: 91-33-66285549/66285509
stock-summary
niccopark@niccoparks.com
Registrar Details
R&D Infotech Pvt Ltd, 7 A Beltala Road, Kolkata