
Compare Nidhi Granites with Similar Stocks
Dashboard
Company has a Debt to Equity ratio (avg) of 0.04 times
Healthy long term growth as Net Sales has grown by an annual rate of 131.30% and Operating profit at 63.24%
The company has declared Positive results for the last 4 consecutive quarters
With ROE of 34.1, it has a Very Expensive valuation with a 14.7 Price to Book Value
40.26% of Promoter Shares are Pledged
Consistent Returns over the last 3 years
Total Returns (Price + Dividend) 
Nidhi Granites for the last several years.
Risk Adjusted Returns v/s
Returns Beta

News
Nidhi Granites Ltd is Rated Hold by MarketsMOJO
Nidhi Granites Ltd is rated 'Hold' by MarketsMOJO, with this rating last updated on 29 May 2026. However, the analysis and financial metrics discussed here reflect the company’s current position as of 11 June 2026, providing investors with an up-to-date perspective on the stock’s fundamentals, valuation, financial trends, and technical outlook.
Read full news article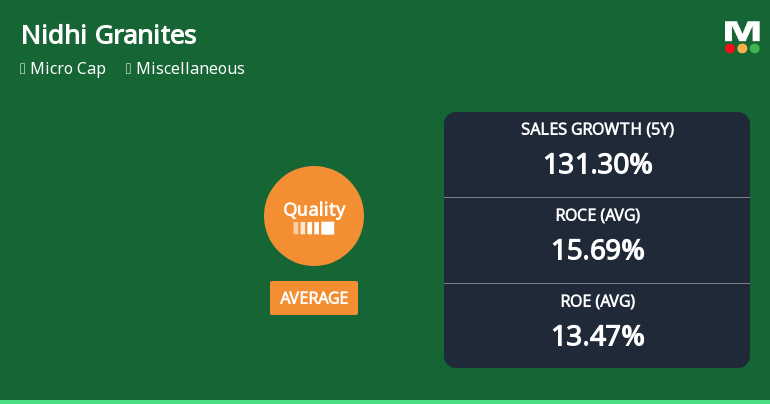
Nidhi Granites Ltd Quality Grade Downgrade: A Detailed Analysis of Business Fundamentals
Nidhi Granites Ltd, a micro-cap player in the miscellaneous sector, has recently seen its quality grade downgraded from 'Good' to 'Average' by MarketsMOJO as of 19 May 2026. This shift reflects notable changes in the company’s business fundamentals, including key metrics such as return on equity (ROE), return on capital employed (ROCE), debt levels, and growth consistency. This article delves into the specifics behind this downgrade, analysing the factors that have improved or deteriorated and what this means for investors.
Read full news article
Nidhi Granites Ltd is Rated Hold by MarketsMOJO
Nidhi Granites Ltd is rated 'Hold' by MarketsMOJO, with this rating last updated on 29 May 2026. While the rating was revised on that date, the analysis and financial metrics discussed here reflect the stock’s current position as of 31 May 2026, providing investors with an up-to-date view of the company’s fundamentals, returns, and market standing.
Read full news article Announcements
Announcement under Regulation 30 (LODR)-Newspaper Publication
30-May-2026 | Source : BSENewspaper Publication for results for 31st March 2026.
Board Meeting Outcome for Outcome Of Board Meeting Held On 29Th May 2026 In Accordance With SEBI (Listing And Obligations And Disclosure Requirements) Regulations 2015
29-May-2026 | Source : BSEOutcome of Board Meeting held on 29th May 2026 in accordance with SEBI (Listing and Obligations and Disclosure Requirements) Regulations 2015
Non Applicability Of Regulation 23(9) Of SEBI (Listing Obligations And Disclosure Requirements) (Amendments) Regulation 2018
29-May-2026 | Source : BSENon applicability of Regulation 23(9) of SEBI (LODR) (Amendments) Regulation 2018
Corporate Actions

No Upcoming Board Meetings

No Dividend history available

No Splits history available

Nidhi Granites Ltd has announced 1:1 bonus issue, ex-date: 02 May 24

No Rights history available
Quality key factors
Valuation key factors
Technicals key factors
 Technical Indicator Scale: Bearish, Mildly Bearish, Sideways, Mildly Bullish, Bullish Turned
 Shareholding Snapshot : Mar 2026
Shareholding Compare (%holding)
Promoters
40.264
Held by 0 Schemes
Held by 0 FIIs
Devan Narendra Pandya (66.75%)
Nayana Balubhai Bhatt (13.53%)
30.15%
Quarterly Results Snapshot (Consolidated) - Mar'26 - QoQ

QoQ Growth in quarter ended Mar 2026 is 7.14% vs 17.98% in Dec 2025
QoQ Growth in quarter ended Mar 2026 is -12.22% vs 71.32% in Dec 2025
Half Yearly Results Snapshot (Consolidated) - Sep'25

Growth in half year ended Sep 2025 is 54.30% vs 29.89% in Sep 2024
Growth in half year ended Sep 2025 is 90.81% vs 1,221.43% in Sep 2024
Nine Monthly Results Snapshot (Consolidated) - Dec'25
YoY Growth in nine months ended Dec 2025 is 39.52% vs 28.28% in Dec 2024
YoY Growth in nine months ended Dec 2025 is 105.73% vs 372.88% in Dec 2024
Annual Results Snapshot (Consolidated) - Mar'26
YoY Growth in year ended Mar 2026 is 43.99% vs 17.58% in Mar 2025
YoY Growth in year ended Mar 2026 is 300.00% vs 182.35% in Mar 2025
About Nidhi Granites Ltd

Company Coordinates


