
Compare Nihon Seiko Co., Ltd. with Similar Stocks
Dashboard
Low Debt Company with Strong Long Term Fundamental Strength
- Company's ability to service its debt is strong with a healthy EBIT to Interest (avg) ratio of 83.47
- The company has been able to generate a Return on Capital Employed (avg) of 18.07% signifying high profitability per unit of total capital (equity and debt)
With a growth in Net Sales of 29.18%, the company declared Very Positive results in Jun 25
With ROE of 20.50%, it has a very attractive valuation with a 1.11 Price to Book Value
Market Beating Performance
Total Returns (Price + Dividend) 
Nihon Seiko Co., Ltd. for the last several years.
Risk Adjusted Returns v/s
News
Nihon Seiko Co., Ltd. Reports Exceptional Financial Performance in June Quarter
Nihon Seiko Co., Ltd. has recently showcased remarkable financial results for the quarter ending June 2025, reflecting a strong operational performance that has caught the attention of investors. The company, categorized as a small-cap entity, has demonstrated significant growth across various financial metrics.
One of the standout figures from the report is the return on capital employed (ROCE), which reached an impressive 35.39%. This indicates the company's effective use of capital to generate profits, a key indicator of financial health. Additionally, Nihon Seiko Co., Ltd. reported net sales of JPY 10,793.3 MM, marking a substantial achievement in revenue generation.
The interest coverage ratio also reached a remarkable 16,712.25, suggesting that the company is well-positioned to meet its interest obligations comfortably. Operating profit for the quar...
Read full news article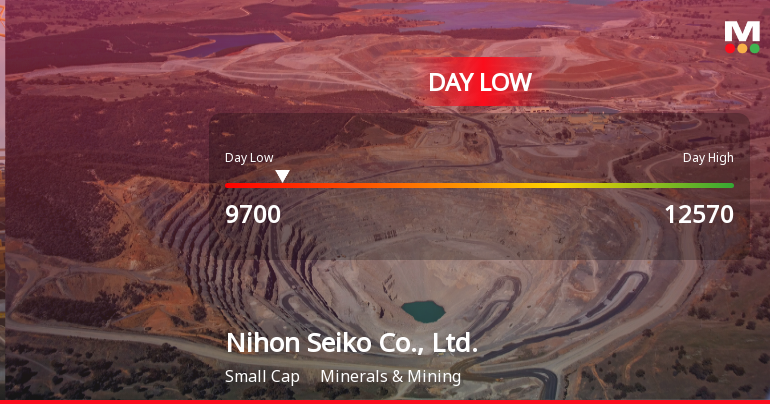
Nihon Seiko Stock Hits Day Low at JPY 9,700 Amid Price Pressure
Nihon Seiko Co. faced notable volatility today, with a significant stock decline. Despite recent downturns, the company has shown impressive annual growth, outperforming the Japan Nikkei 225. Its financial health remains strong, characterized by a robust EBIT to interest ratio and consistent positive results over the past six quarters.
Read full news article Announcements

Corporate Actions
Quality key factors
Valuation key factors
Technicals key factors
 Technical Indicator Scale: Bearish, Mildly Bearish, Sideways, Mildly Bullish, Bullish Turned
 Shareholding Snapshot
Shareholding Compare (%holding)
Quarterly Results Snapshot (Consolidated) - Sep'25 - QoQ

QoQ Growth in quarter ended Sep 2025 is -6.92% vs 37.57% in Jun 2025
QoQ Growth in quarter ended Sep 2025 is -32.15% vs 55.11% in Jun 2025
Annual Results Snapshot (Consolidated) - Mar'25

YoY Growth in year ended Mar 2025 is 61.52% vs -2.10% in Mar 2024
YoY Growth in year ended Mar 2025 is 388.58% vs 4.32% in Mar 2024
About Nihon Seiko Co., Ltd.

Company Coordinates


