
Compare NIIT with Similar Stocks
Stock DNA
Other Consumer Services
INR 1,388 Cr (Micro Cap)
109.00
19
0.96%
-0.63
1.19%
1.33
Total Returns (Price + Dividend) 
Latest dividend: 1 per share ex-dividend date: Sep-04-2025
Risk Adjusted Returns v/s
Returns Beta

News

NIIT Ltd Technical Momentum Shifts Amid Mixed Indicator Signals
NIIT Ltd has experienced a notable shift in its technical momentum, moving from a sideways trend to a mildly bearish stance, despite a strong intraday price surge of 9.32% to ₹103.79. This article analyses the recent technical indicator signals, including MACD, RSI, moving averages, and other momentum oscillators, to provide a comprehensive view of the stock’s current positioning and outlook.
Read full news article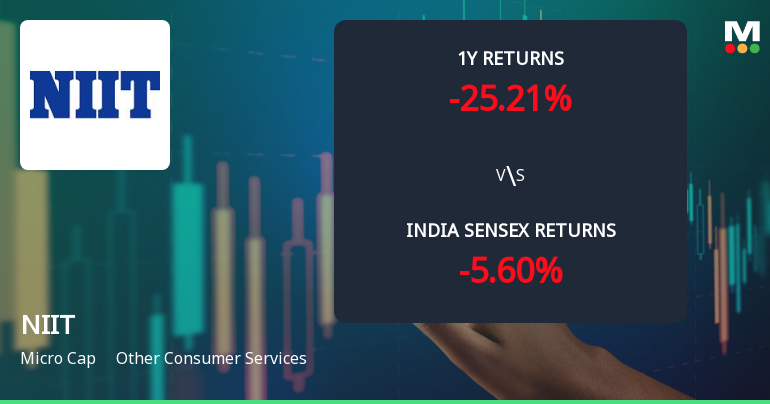
NIIT Ltd Technical Momentum Shifts Amid Mixed Indicator Signals
NIIT Ltd, a micro-cap player in the Other Consumer Services sector, has experienced a notable shift in its technical momentum, moving from a mildly bearish stance to a sideways trend. Despite a recent downgrade to a Strong Sell rating by MarketsMOJO, the stock exhibits a complex interplay of bullish and bearish signals across key technical indicators, warranting a detailed analysis for investors navigating this volatile terrain.
Read full news article
NIIT Ltd is Rated Strong Sell
NIIT Ltd is rated Strong Sell by MarketsMOJO, with this rating last updated on 16 June 2025. However, the analysis and financial metrics discussed here reflect the company’s current position as of 15 June 2026, providing investors with the most up-to-date perspective on the stock’s fundamentals, valuation, financial trend, and technical outlook.
Read full news article Announcements
Announcement under Regulation 30 (LODR)-Scheme of Arrangement
17-Jun-2026 | Source : BSEReceipt of Certified copy of the Order dated May 22 2026 of Honbe NCLT for approving the Scheme on June 16 2026.
Announcement under Regulation 30 (LODR)-Change in Directorate
16-Jun-2026 | Source : BSEReappointment of Independent director for second term
Announcement under Regulation 30 (LODR)-Allotment of ESOP / ESPS
16-Jun-2026 | Source : BSEPlease find intimation of allotment of shares under the Employees Stock Option Plan 2005
Corporate Actions

No Upcoming Board Meetings

NIIT Ltd has declared 50% dividend, ex-date: 04 Sep 25

NIIT Ltd has announced 2:10 stock split, ex-date: 24 Aug 07

NIIT Ltd has announced 1:2 bonus issue, ex-date: 24 Aug 07

No Rights history available
Quality key factors
Valuation key factors
Technicals key factors
 Technical Indicator Scale: Bearish, Mildly Bearish, Sideways, Mildly Bullish, Bullish Turned
 Shareholding Snapshot : Mar 2026
Shareholding Compare (%holding)
Non Institution
None
Held by 3 Schemes (8.15%)
Held by 46 FIIs (10.11%)
Vijay Kumar Thadani As Trustee Of Thadani Family Trust (18.16%)
Nippon Life India Trustee Ltd-a/c Nippon India Small Cap Fund (8.15%)
31.12%
Quarterly Results Snapshot (Consolidated) - Mar'26 - YoY

YoY Growth in quarter ended Mar 2026 is 15.59% vs 16.07% in Mar 2025
YoY Growth in quarter ended Mar 2026 is -133.64% vs 17.64% in Mar 2025
Half Yearly Results Snapshot (Consolidated) - Sep'25
Growth in half year ended Sep 2025 is 9.16% vs 20.31% in Sep 2024
Growth in half year ended Sep 2025 is -70.65% vs 52.69% in Sep 2024
Nine Monthly Results Snapshot (Consolidated) - Dec'25
YoY Growth in nine months ended Dec 2025 is 7.05% vs 18.40% in Dec 2024
YoY Growth in nine months ended Dec 2025 is -70.60% vs 21.29% in Dec 2024
Annual Results Snapshot (Consolidated) - Mar'26
YoY Growth in year ended Mar 2026 is 9.11% vs 17.83% in Mar 2025
YoY Growth in year ended Mar 2026 is -88.55% vs 20.26% in Mar 2025
About NIIT Ltd

Company Coordinates


