
Compare NIIT Learning with Similar Stocks
Dashboard
High Management Efficiency with a high ROE of 18.74%
The company is Net-Debt Free
Poor long term growth as Net Sales has grown by an annual rate of 12.75% and Operating profit at 5.89% over the last 5 years
Flat results in Mar 26
With ROE of 14.5, it has a Attractive valuation with a 2.2 Price to Book Value
High Institutional Holdings at 41.22%
Below par performance in long term as well as near term
With its market cap of Rs 3,302 cr, it is the second biggest company in the sector (behind Crizac)and constitutes 31.36% of the entire sector
Stock DNA
Other Consumer Services
INR 3,708 Cr (Small Cap)
15.00
19
1.25%
-0.37
14.52%
2.14
Total Returns (Price + Dividend) 
Latest dividend: 3 per share ex-dividend date: Sep-04-2025
Risk Adjusted Returns v/s
Returns Beta

News

NIIT Learning Systems Ltd Surges 13.23% to Day's High of Rs 272.5 — Outperforms Sector by 13.21 Percentage Points
The Sensex edged up a modest 0.06% on 7 Jul 2026, while NIIT Learning Systems Ltd surged 13.23%, outperforming its sector by 13.21 percentage points. This sharp single-session gain stands out as a stock-specific event amid a broadly steady market environment.
Read full news article
NIIT Learning Systems Ltd is Rated Sell
NIIT Learning Systems Ltd is rated 'Sell' by MarketsMOJO, with this rating last updated on 29 June 2026. However, the analysis and financial metrics discussed here reflect the stock's current position as of 05 July 2026, providing investors with the latest insights into the company’s performance and outlook.
Read full news article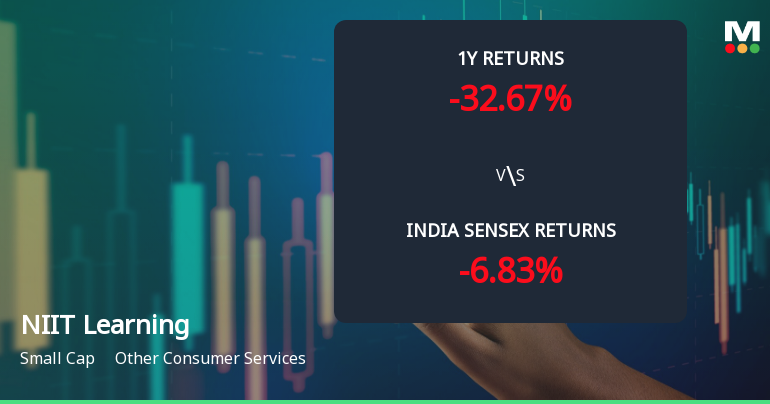
NIIT Learning Systems Ltd Technical Momentum Shifts Amid Bearish Trends
NIIT Learning Systems Ltd has experienced a notable shift in its technical momentum, moving from a mildly bearish stance to a more pronounced bearish trend. Despite a recent upgrade in its Mojo Grade from Sell to Hold, the stock faces downward pressure amid mixed technical signals and a challenging broader market environment.
Read full news article Announcements
Corporate Actions

No Upcoming Board Meetings

NIIT Learning Systems Ltd has declared 150% dividend, ex-date: 04 Sep 25

No Splits history available

No Bonus history available

No Rights history available
Quality key factors
Valuation key factors
Technicals key factors
 Technical Indicator Scale: Bearish, Mildly Bearish, Sideways, Mildly Bullish, Bullish Turned
 Shareholding Snapshot : Mar 2026
Shareholding Compare (%holding)
Promoters
None
Held by 6 Schemes (18.56%)
Held by 120 FIIs (16.75%)
Vijay Kumar Thadani As Trustee Of Thadani Family Trust (16.72%)
Nippon Life India Trustee Ltd. - A/c Nippon India Small Cap Fund (8.88%)
16.4%
Quarterly Results Snapshot (Consolidated) - Mar'26 - QoQ

QoQ Growth in quarter ended Mar 2026 is 5.11% vs 5.04% in Dec 2025

QoQ Growth in quarter ended Mar 2026 is 3.73% vs 58.30% in Dec 2025
Half Yearly Results Snapshot (Consolidated) - Sep'25
Growth in half year ended Sep 2025 is 15.21% vs 5.29% in Sep 2024
Growth in half year ended Sep 2025 is -17.76% vs 14.71% in Sep 2024
Nine Monthly Results Snapshot (Consolidated) - Dec'25
YoY Growth in nine months ended Dec 2025 is 16.61% vs 5.88% in Dec 2024
YoY Growth in nine months ended Dec 2025 is -4.58% vs 12.59% in Dec 2024
Annual Results Snapshot (Consolidated) - Mar'26
YoY Growth in year ended Mar 2026 is 18.07% vs 6.42% in Mar 2025
YoY Growth in year ended Mar 2026 is 8.89% vs 6.69% in Mar 2025
About NIIT Learning Systems Ltd

Company Coordinates


