
Compare NILE with Similar Stocks
Dashboard
Company has a Debt to Equity ratio (avg) of 0.08 times
The company has declared Positive results for the last 4 consecutive quarters
With ROE of 17.5, it has a Very Attractive valuation with a 1.6 Price to Book Value
Despite the size of the company, domestic mutual funds hold only 0% of the company
Consistent Returns over the last 3 years
Stock DNA
Minerals & Mining
INR 514 Cr (Micro Cap)
9.00
14
0.30%
-0.07
17.46%
1.58
Total Returns (Price + Dividend) 
Latest dividend: 5 per share ex-dividend date: Nov-28-2025
Risk Adjusted Returns v/s
Returns Beta

News
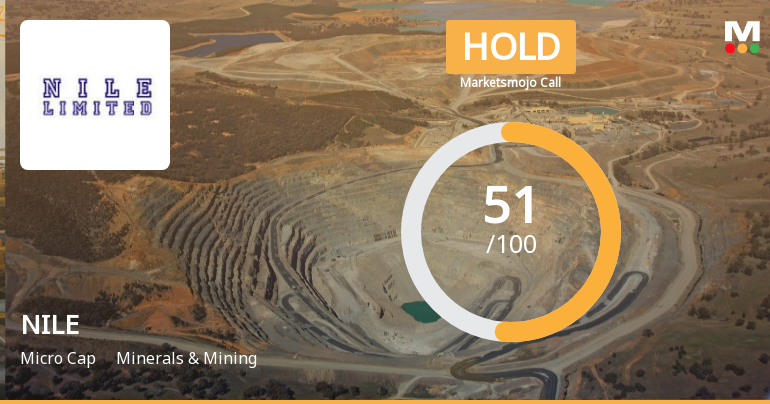
NILE Ltd Upgraded to Hold by MarketsMOJO on Improved Valuation and Financial Metrics
NILE Ltd, a micro-cap player in the Minerals & Mining sector, has seen its investment rating upgraded from Sell to Hold as of 8 June 2026. This change reflects significant improvements across valuation metrics, financial trends, and quality assessments, despite a modest negative price movement on the day. The upgrade signals growing investor confidence in the company’s fundamentals and outlook amid a challenging market backdrop.
Read full news article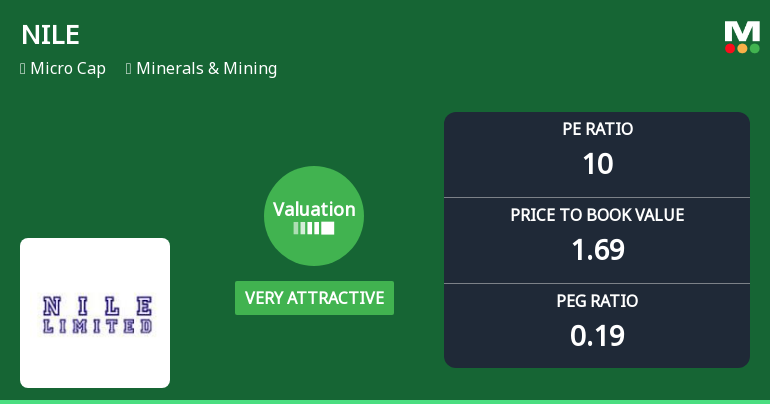
NILE Ltd Valuation Shifts to Very Attractive Amid Market Volatility
NILE Ltd, a micro-cap player in the Minerals & Mining sector, has witnessed a significant shift in its valuation parameters, moving from an attractive to a very attractive rating. This change comes amid a backdrop of mixed market returns and evolving investor sentiment, prompting a closer examination of the company’s price-to-earnings (P/E) and price-to-book value (P/BV) ratios relative to historical and peer benchmarks.
Read full news article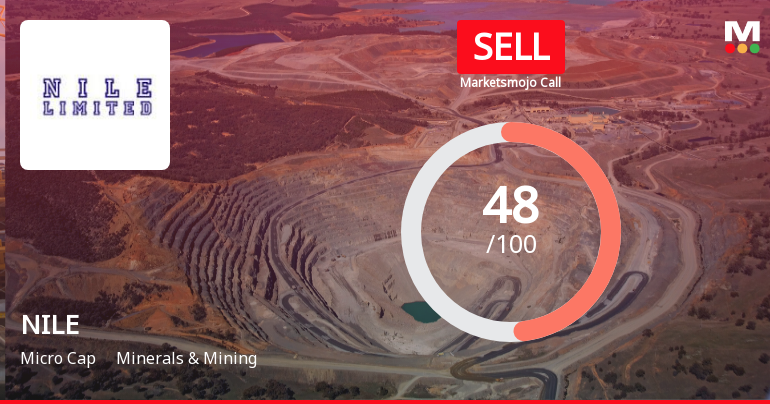
NILE Ltd Downgraded to Sell by MarketsMOJO Amid Mixed Financial and Technical Signals
NILE Ltd, a micro-cap player in the Minerals & Mining sector, has seen its investment rating downgraded from Hold to Sell as of 1 June 2026. This shift reflects a nuanced reassessment across four key parameters: quality, valuation, financial trend, and technicals. Despite some encouraging financial metrics, the overall outlook has been tempered by mixed signals from recent quarterly results and technical indicators, prompting a cautious stance among investors.
Read full news article Announcements
Announcement under Regulation 30 (LODR)-Newspaper Publication
08-Jun-2026 | Source : BSEPlease find the enclosed newspaper cuttings of the advertisement of the Special Window for transfer and dematerialisation of physical securities in Prajasakti (Telugu) and Financial Express (English).
Announcement under Regulation 30 (LODR)-Newspaper Publication
26-May-2026 | Source : BSEPlease find the enclosed newspaper cuttings of the advertisement of the Audited Standalone and Consolidated Financial Results for the quarter ended 31st March 2026 in Prajasakti (Telugu) and Financial Express (English)
Board Meeting Outcome for Outcome Of The Board Meeting Held On 25Th May 2026
25-May-2026 | Source : BSEThe Board of Directors inter alia Approved the Audited Standalone and Consolidated Financial Results for the financial year ended 31st March 2026 and the same are enclosed along with the Auditors Report and declaration under Regulation 33(3)(d) of SEBI(LODR) Regulations 2015 in the Board Meeting held on 25th May 2026 at 11.20 am and concluded at 1.30 pm.
Corporate Actions

No Upcoming Board Meetings

NILE Ltd has declared 50% dividend, ex-date: 28 Nov 25

No Splits history available

No Bonus history available

No Rights history available
Quality key factors
Valuation key factors
Technicals key factors
 Technical Indicator Scale: Bearish, Mildly Bearish, Sideways, Mildly Bullish, Bullish Turned
 Shareholding Snapshot : Mar 2026
Shareholding Compare (%holding)
Promoters
None
Held by 0 Schemes
Held by 2 FIIs (0.16%)
Vuyyuru Rajeswari (26.71%)
Dhiraj Omprakash Sachdev (2.26%)
42.26%
Quarterly Results Snapshot (Consolidated) - Mar'26 - QoQ

QoQ Growth in quarter ended Mar 2026 is -21.15% vs 6.37% in Dec 2025
QoQ Growth in quarter ended Mar 2026 is -8.29% vs 28.97% in Dec 2025
Half Yearly Results Snapshot (Consolidated) - Sep'25
Growth in half year ended Sep 2025 is 4.47% vs 20.66% in Sep 2024

Growth in half year ended Sep 2025 is 60.92% vs 24.57% in Sep 2024
Nine Monthly Results Snapshot (Consolidated) - Dec'25
YoY Growth in nine months ended Dec 2025 is 11.12% vs 9.96% in Dec 2024
YoY Growth in nine months ended Dec 2025 is 55.71% vs 6.14% in Dec 2024
Annual Results Snapshot (Consolidated) - Mar'26
YoY Growth in year ended Mar 2026 is 13.15% vs 9.78% in Mar 2025
YoY Growth in year ended Mar 2026 is 52.06% vs 16.62% in Mar 2025
About NILE Ltd

Company Coordinates


