
Compare NIS Management with Similar Stocks
Stock DNA
Diversified Commercial Services
INR 90 Cr (Micro Cap)
3.00
33
0.00%
0.07
12.45%
0.49
Total Returns (Price + Dividend) 
NIS Management for the last several years.
Risk Adjusted Returns v/s
Returns Beta

News
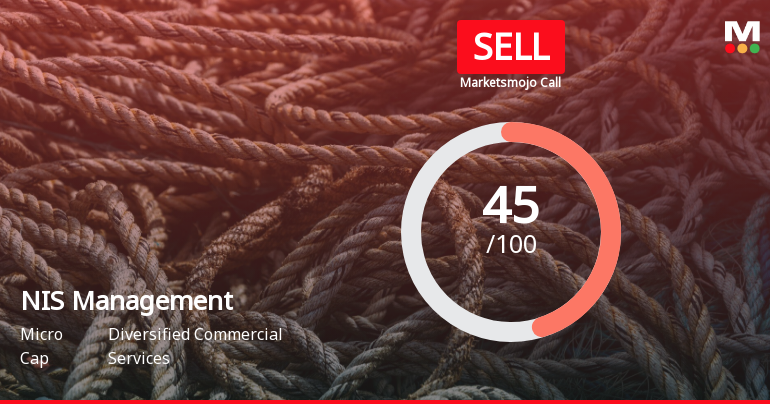
NIS Management Ltd is Rated Sell
NIS Management Ltd is rated 'Sell' by MarketsMOJO, with this rating last updated on 25 June 2026. However, the analysis and financial metrics discussed here reflect the stock's current position as of 07 July 2026, providing investors with an up-to-date view of the company's fundamentals, valuation, financial trends, and technical outlook.
Read full news article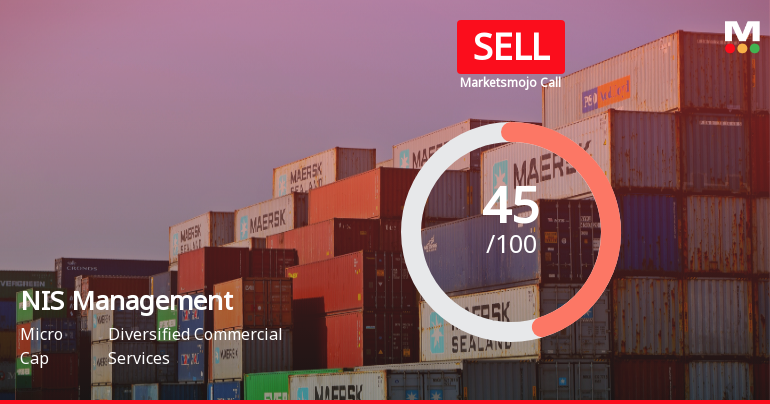
NIS Management Ltd Downgraded to Sell Amid Weak Technicals and Earnings Pressure
NIS Management Ltd, a micro-cap player in the diversified commercial services sector, has seen its investment rating downgraded from Hold to Sell as of 25 June 2026. This decision follows a comprehensive reassessment across four critical parameters: quality, valuation, financial trend, and technicals. The downgrade reflects deteriorating technical indicators, subdued long-term growth, and a challenging market environment, despite some attractive valuation metrics.
Read full news article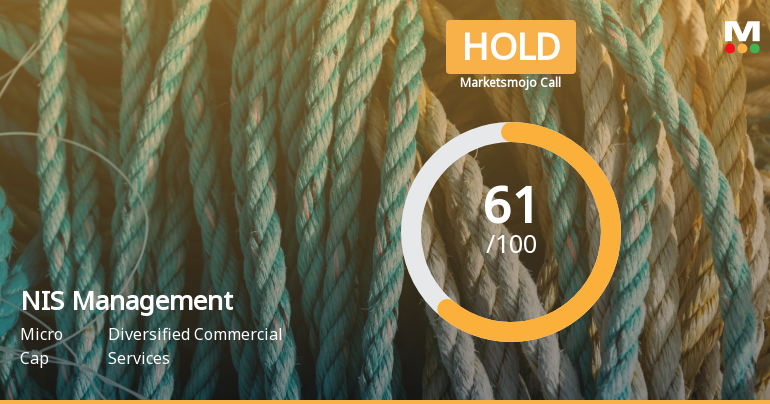
NIS Management Ltd is Rated Hold by MarketsMOJO
NIS Management Ltd is rated 'Hold' by MarketsMOJO, with this rating last updated on 01 June 2026. However, the analysis and financial metrics discussed here reflect the stock's current position as of 16 June 2026, providing investors with the latest insights into the company’s performance and outlook.
Read full news article Announcements
Announcement under Regulation 30 (LODR)-Press Release / Media Release
06-Jul-2026 | Source : BSEPress Release on Securing a 11.90 Crore Security Services work order in west bengal
Compliances-Certificate under Reg. 74 (5) of SEBI (DP) Regulations 2018
01-Jul-2026 | Source : BSECertificate Under Reg 74 of SEBI DP Regulations 2018
Closure of Trading Window
25-Jun-2026 | Source : BSEIntimation of Closure of Trading Window
Corporate Actions

No Upcoming Board Meetings

No Dividend history available

No Splits history available

No Bonus history available

No Rights history available
Quality key factors
Valuation key factors
Technicals key factors
 Technical Indicator Scale: Bearish, Mildly Bearish, Sideways, Mildly Bullish, Bullish Turned
 Shareholding Snapshot : Mar 2026
Shareholding Compare (%holding)
Promoters
None
Held by 0 Schemes
Held by 7 FIIs (3.1%)
Debajit Choudhury (60.85%)
Share India Securities Limited . Inv (3.64%)
12.82%
Quarterly Results Snapshot (Standalone) - Mar'26 - QoQ

QoQ Growth in quarter ended Mar 2026 is 13.48% vs -9.35% in Dec 2025

QoQ Growth in quarter ended Mar 2026 is -804.68% vs 25.67% in Dec 2025
Half Yearly Results Snapshot (Consolidated) - Sep'25
Growth in half year ended Sep 2025 is 5.35% vs 2.07% in Mar 2025
Growth in half year ended Sep 2025 is 6.57% vs 5.62% in Mar 2025
Nine Monthly Results Snapshot (Standalone) - Dec'25
Not Applicable: The company has declared_date for only one period
Not Applicable: The company has declared_date for only one period
Annual Results Snapshot (Consolidated) - Mar'26
YoY Growth in year ended Mar 2026 is 7.77% vs 6.40% in Mar 2025
YoY Growth in year ended Mar 2026 is -109.91% vs 1.41% in Mar 2025
About NIS Management Ltd

Company Coordinates


