
Compare NIS Management with Similar Stocks
Dashboard
Strong ability to service debt as the company has a low Debt to EBITDA ratio of 3.01 times
Poor long term growth as Operating profit has grown by an annual rate -22.24% of over the last 5 years
Flat results in Mar 26
With ROE of 12.4, it has a Very Attractive valuation with a 0.5 Price to Book Value
Stock DNA
Diversified Commercial Services
INR 99 Cr (Micro Cap)
3.00
32
0.00%
0.07
12.45%
0.54
Total Returns (Price + Dividend) 
NIS Management for the last several years.
Risk Adjusted Returns v/s
Returns Beta

News

NIS Management Ltd is Rated Hold by MarketsMOJO
NIS Management Ltd is rated 'Hold' by MarketsMOJO, with this rating last updated on 01 June 2026. However, the analysis and financial metrics presented here reflect the stock's current position as of 03 June 2026, providing investors with the most up-to-date view of the company’s fundamentals, returns, and market standing.
Read full news article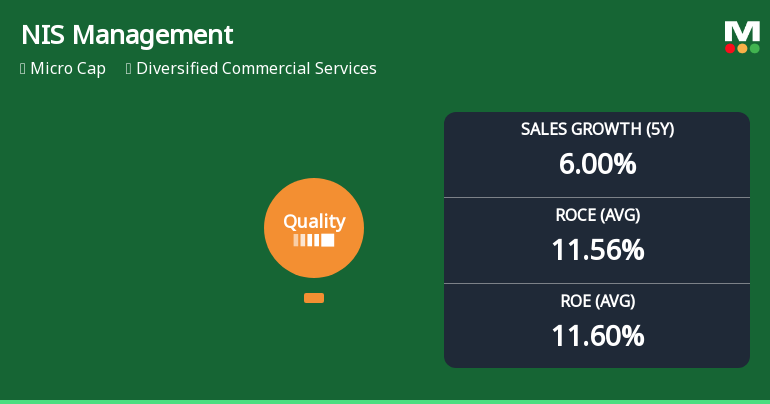
NIS Management Ltd Quality Grade Upgrade: A Detailed Analysis of Business Fundamentals
NIS Management Ltd has seen its quality grade upgraded from below average to average, reflecting notable shifts in its business fundamentals. This article analyses the key financial metrics, including return on equity (ROE), return on capital employed (ROCE), debt levels, and growth trends, to assess the implications of this change for investors and the company’s future prospects.
Read full news article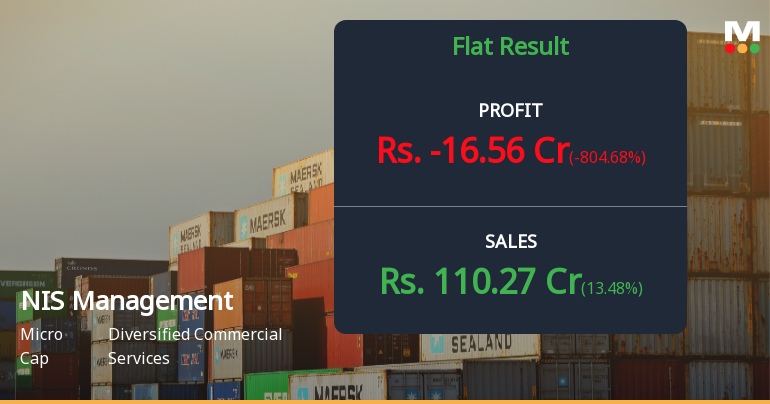
NIS Management Q4 FY26: Massive Loss Erases Year's Gains as One-Time Charge Hits Bottom Line
NIS Management Ltd., a Kolkata-based diversified commercial services provider, reported a shocking quarterly loss of ₹14.03 crores in Q4 FY26, a dramatic reversal from the ₹6.01 crores profit posted in the same quarter last year. The 493.28% year-on-year decline in consolidated net profit was driven by an exceptional charge of ₹27.82 crores that pushed profit before tax into deeply negative territory at ₹20.16 crores. The stock plummeted 7.78% to ₹50.48 following the results announcement, extending its year-to-date decline to 29.10% and raising serious questions about the company's near-term prospects.
Read full news article Announcements
Announcement under Regulation 30 (LODR)-Earnings Call Transcript
08-Jun-2026 | Source : BSETranscript of the Investors Earnings Call held on June 05 2026 on the Audited Standalone and Consolidated Financial Results for the Quarter and year ended March 31 2026.
Announcement under Regulation 30 (LODR)-Award_of_Order_Receipt_of_Order
08-Jun-2026 | Source : BSERenewal of Work Order to the company by Reliance Group
Announcement under Regulation 30 (LODR)-Analyst / Investor Meet - Outcome
05-Jun-2026 | Source : BSEOutcome & Audio recording of the Investors earnings Call held on 05th June 2026 on the Audited Standalone and Consolidated Financial Results for quarter and year ended March 31 2026.
Corporate Actions

No Upcoming Board Meetings

No Dividend history available

No Splits history available

No Bonus history available

No Rights history available
Quality key factors
Valuation key factors
Technicals key factors
 Technical Indicator Scale: Bearish, Mildly Bearish, Sideways, Mildly Bullish, Bullish Turned
 Shareholding Snapshot : Mar 2026
Shareholding Compare (%holding)
Promoters
None
Held by 0 Schemes
Held by 7 FIIs (3.1%)
Debajit Choudhury (60.85%)
Share India Securities Limited . Inv (3.64%)
12.82%
Quarterly Results Snapshot (Standalone) - Mar'26 - QoQ

QoQ Growth in quarter ended Mar 2026 is 13.48% vs -9.35% in Dec 2025

QoQ Growth in quarter ended Mar 2026 is -804.68% vs 25.67% in Dec 2025
Half Yearly Results Snapshot (Consolidated) - Sep'25
Growth in half year ended Sep 2025 is 5.35% vs 2.07% in Mar 2025
Growth in half year ended Sep 2025 is 6.57% vs 5.62% in Mar 2025
Nine Monthly Results Snapshot (Standalone) - Dec'25
Not Applicable: The company has declared_date for only one period
Not Applicable: The company has declared_date for only one period
Annual Results Snapshot (Consolidated) - Mar'26
YoY Growth in year ended Mar 2026 is 7.77% vs 6.40% in Mar 2025
YoY Growth in year ended Mar 2026 is -109.91% vs 1.41% in Mar 2025
About NIS Management Ltd

Company Coordinates


