
Compare Nitin Spinners with Similar Stocks
Stock DNA
Garments & Apparels
INR 3,092 Cr (Small Cap)
17.00
24
0.53%
0.76
12.07%
2.15
Total Returns (Price + Dividend) 
Latest dividend: 3 per share ex-dividend date: Aug-29-2025
Risk Adjusted Returns v/s
Returns Beta

News
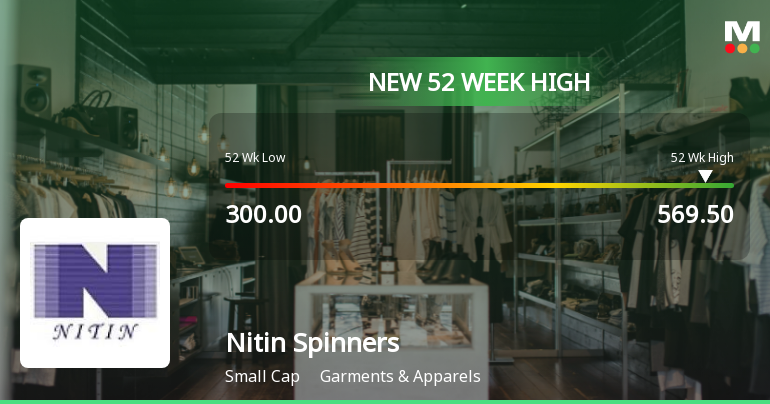
Broad-Based Technical Strength Lifts Nitin Spinners Ltd to 52-Week High of Rs 569.5
With a decisive breakthrough to Rs 569.5 on 15 Jun 2026, Nitin Spinners Ltd has reached a fresh 52-week and all-time high, marking a 41.08% gain over the past year. This milestone comes amid a backdrop of strong technical momentum and sustained outperformance versus the broader market, which has declined by 5.54% over the same period.
Read full news article
Nitin Spinners Ltd is Rated Buy by MarketsMOJO
Nitin Spinners Ltd is rated 'Buy' by MarketsMOJO, with this rating last updated on 27 April 2026. However, the analysis and financial metrics discussed here reflect the stock's current position as of 11 June 2026, providing investors with the most up-to-date insights into the company’s performance and outlook.
Read full news article
Nitin Spinners Ltd is Rated Buy
Nitin Spinners Ltd is rated 'Buy' by MarketsMOJO, with this rating last updated on 27 Apr 2026. However, the analysis and financial metrics discussed here reflect the stock’s current position as of 31 May 2026, providing investors with the most up-to-date insight into its performance and outlook.
Read full news article Announcements
Announcement under Regulation 30 (LODR)-Analyst / Investor Meet - Intimation
13-Jun-2026 | Source : BSEIntimation of Schedule of Analyst/Institutional Investor Meeting
Announcement under Regulation 30 (LODR)-Earnings Call Transcript
14-May-2026 | Source : BSETRANSCRIPT OF ANALYST/INVESTOR EARNINGS CALL HELD ON 11.05.2026
Analyst / Investor Earning Call Audio Recording
11-May-2026 | Source : BSEAnalyst / Investor Earning Call Audio Recording
Corporate Actions

No Upcoming Board Meetings

Nitin Spinners Ltd has declared 30% dividend, ex-date: 29 Aug 25

No Splits history available

No Bonus history available

No Rights history available
Quality key factors
Valuation key factors
Technicals key factors
 Technical Indicator Scale: Bearish, Mildly Bearish, Sideways, Mildly Bullish, Bullish Turned
 Shareholding Snapshot : Mar 2026
Shareholding Compare (%holding)
Promoters
None
Held by 5 Schemes (14.08%)
Held by 40 FIIs (1.09%)
Redial Trading And Investment Private Limited (32.18%)
Bandhan Small Cap Fund (6.3%)
22.45%
Quarterly Results Snapshot (Standalone) - Mar'26 - QoQ

QoQ Growth in quarter ended Mar 2026 is 7.38% vs 5.34% in Dec 2025
QoQ Growth in quarter ended Mar 2026 is 29.16% vs 27.65% in Dec 2025
Half Yearly Results Snapshot (Standalone) - Sep'25

Growth in half year ended Sep 2025 is -4.43% vs 20.01% in Sep 2024
Growth in half year ended Sep 2025 is -10.10% vs 39.08% in Sep 2024
Nine Monthly Results Snapshot (Standalone) - Dec'25
YoY Growth in nine months ended Dec 2025 is -4.47% vs 17.08% in Dec 2024
YoY Growth in nine months ended Dec 2025 is -6.88% vs 39.75% in Dec 2024
Annual Results Snapshot (Standalone) - Mar'26
YoY Growth in year ended Mar 2026 is -2.78% vs 13.77% in Mar 2025
YoY Growth in year ended Mar 2026 is 1.21% vs 33.39% in Mar 2025
About Nitin Spinners Ltd

Company Coordinates


