
Compare Nitiraj Engineer with Similar Stocks
Dashboard
With a Operating Losses, the company has a Weak Long Term Fundamental Strength
- The company has been able to generate a Return on Equity (avg) of 4.92% signifying low profitability per unit of shareholders funds
The company has declared negative results for the last 2 consecutive quarters
With ROE of 1.3, it has a Very Expensive valuation with a 2.4 Price to Book Value
Below par performance in long term as well as near term
Stock DNA
Industrial Manufacturing
INR 202 Cr (Micro Cap)
NA (Loss Making)
37
0.81%
-0.10
1.26%
2.25
Total Returns (Price + Dividend) 
Latest dividend: 1.5 per share ex-dividend date: Sep-16-2025
Risk Adjusted Returns v/s
Returns Beta

News
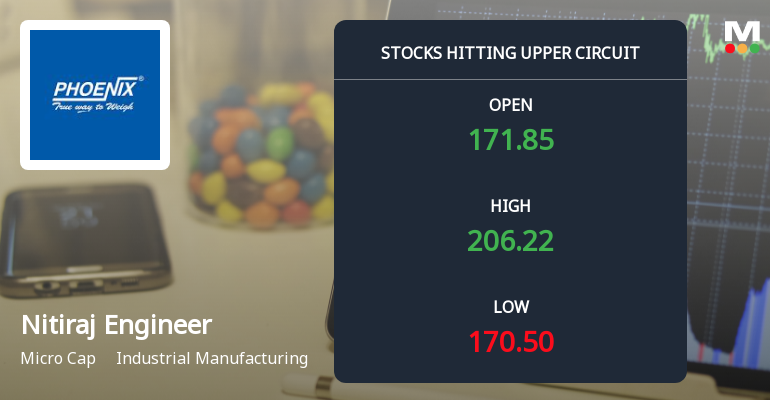
Nitiraj Engineers Ltd Locks at Upper Circuit With 20% Gain — Buyers Queue, Sellers Absent
At Rs 206.22, the buying was done — not because demand dried up, but because the exchange wouldn't let the stock go any higher. Nitiraj Engineers Ltd locked at its upper circuit of 20% on 10 Jun 2026, with buyers queuing and no sellers willing to part with shares.
Read full news article
Micro-Cap Nitiraj Engineers Ltd Locks at Upper Circuit — Rs 0.42 Crore Turnover and Rising Delivery Tell the Story
At Rs 209.89, the buying was done — not because demand dried up, but because the exchange wouldn't let the stock go any higher. Nitiraj Engineers Ltd locked at its upper circuit of 20%% on 01 Jun 2026, with buyers queuing and no sellers willing to part with shares, signalling unfilled demand in a micro-cap context.
Read full news article
Nitiraj Engineers Ltd is Rated Strong Sell
Nitiraj Engineers Ltd is rated Strong Sell by MarketsMOJO. This rating was last updated on 16 Feb 2026. However, the analysis and financial metrics discussed below reflect the stock’s current position as of 29 May 2026, providing investors with the latest insights into the company’s performance and outlook.
Read full news article Announcements
Nitiraj Engineers Limited - Clarification - Financial Results
09-Dec-2019 | Source : NSENitiraj Engineers Limitedeers Limited for the quarter ended 30-Sep-2019 with respect to Regulation 33 of the SEBI (Listing Obligations and Disclosure Requirements) Regulations, 2015.
Nitiraj Engineers Limited - Investor Presentation
05-Dec-2019 | Source : NSENitiraj Engineers Limited has informed the Exchange regarding Investor Presentation
Nitiraj Engineers Limited - Investor Presentation
21-Nov-2019 | Source : NSENitiraj Engineers Limited has informed the Exchange regarding Investor Presentation
Corporate Actions

No Upcoming Board Meetings

Nitiraj Engineers Ltd has declared 15% dividend, ex-date: 16 Sep 25

No Splits history available

Nitiraj Engineers Ltd has announced 1:4 bonus issue, ex-date: 30 Sep 19

No Rights history available
Quality key factors
Valuation key factors
Technicals key factors
 Technical Indicator Scale: Bearish, Mildly Bearish, Sideways, Mildly Bullish, Bullish Turned
 Shareholding Snapshot : Mar 2026
Shareholding Compare (%holding)
Promoters
None
Held by 0 Schemes
Held by 0 FIIs
Rajesh Raghunath Bhatwal (44.91%)
Yi Hung Sin (7.98%)
17.16%
Quarterly Results Snapshot (Standalone) - Mar'26 - YoY

YoY Growth in quarter ended Mar 2026 is -63.82% vs -57.00% in Mar 2025
YoY Growth in quarter ended Mar 2026 is -966.67% vs -100.81% in Mar 2025
Half Yearly Results Snapshot (Standalone) - Sep'25

Growth in half year ended Sep 2025 is 60.01% vs -39.04% in Sep 2024
Growth in half year ended Sep 2025 is 179.75% vs -165.73% in Sep 2024
Nine Monthly Results Snapshot (Standalone) - Dec'25
YoY Growth in nine months ended Dec 2025 is -29.07% vs 12.64% in Dec 2024
YoY Growth in nine months ended Dec 2025 is -65.37% vs 5.63% in Dec 2024
Annual Results Snapshot (Standalone) - Mar'26
YoY Growth in year ended Mar 2026 is -39.35% vs -23.82% in Mar 2025
YoY Growth in year ended Mar 2026 is -78.05% vs -59.88% in Mar 2025
About Nitiraj Engineers Ltd

Company Coordinates


