
Compare Nitta Gelatin with Similar Stocks
Dashboard
Company has a Debt to Equity ratio (avg) of 0.09 times
Positive results in Mar 26
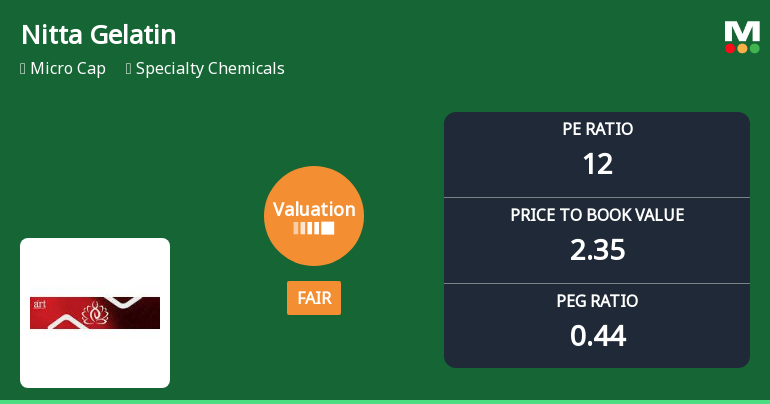
With ROE of 19.2, it has a Expensive valuation with a 2.5 Price to Book Value
Despite the size of the company, domestic mutual funds hold only 0.04% of the company
Market Beating performance in long term as well as near term
Stock DNA
Specialty Chemicals
INR 1,271 Cr (Micro Cap)
13.00
41
0.61%
-0.35
19.17%
2.35
Total Returns (Price + Dividend) 
Latest dividend: 6 per share ex-dividend date: Jul-25-2025
Risk Adjusted Returns v/s
Returns Beta

News
Nitta Gelatin India Ltd Valuation Shifts Signal Renewed Price Attractiveness
Nitta Gelatin India Ltd has witnessed a notable shift in its valuation parameters, moving from an expensive to a fair price territory, signalling improved price attractiveness for investors. This change comes amid a backdrop of strong operational metrics and robust returns, contrasting favourably with its specialty chemicals peers and broader market benchmarks.
Read full news article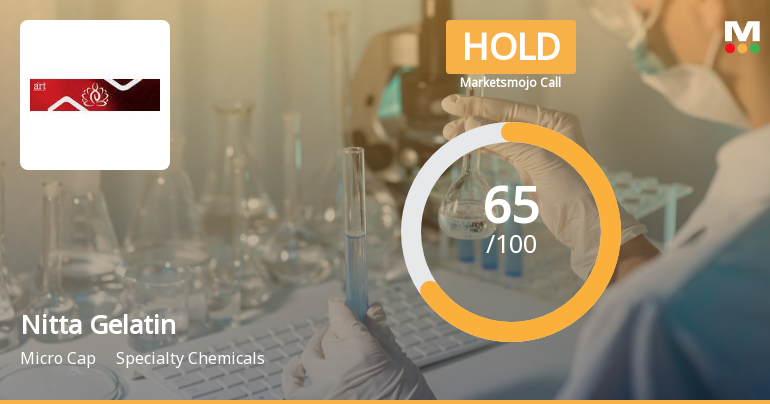
Nitta Gelatin India Ltd is Rated Hold
Nitta Gelatin India Ltd is rated 'Hold' by MarketsMOJO, with this rating last updated on 17 April 2026. However, the analysis and financial metrics discussed here reflect the stock's current position as of 09 June 2026, providing investors with an up-to-date view of the company’s performance and outlook.
Read full news article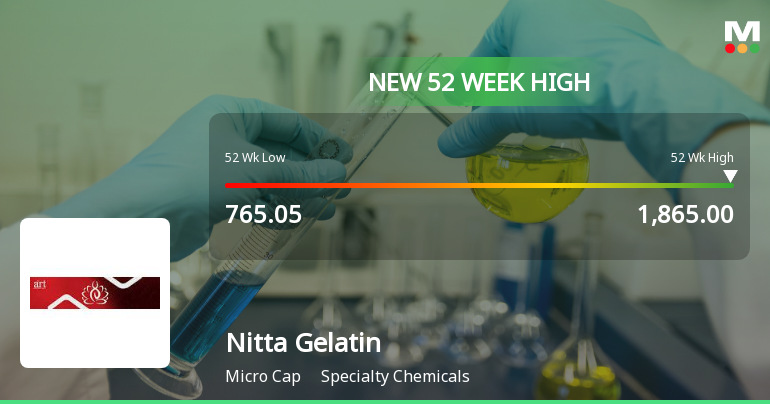
Broad-Based Technical Strength Lifts Nitta Gelatin India Ltd to 52-Week High of Rs 1865
Surging past its previous peaks, Nitta Gelatin India Ltd reached a fresh 52-week high of Rs 1865 on 4 Jun 2026, marking a remarkable 119.9% gain over the past year. This milestone comes amid a backdrop of strong technical momentum that has propelled the stock well ahead of the broader market, which has struggled to maintain its footing.
Read full news article Announcements
Announcement under Regulation 30 (LODR)-Newspaper Publication
11-Jun-2026 | Source : BSENewspaper Advertisements published in Financial Express and Mangalam on transfer of equity shares of the Company to Investor Education and Protection Fund (IEPF)
Announcement under Regulation 30 (LODR)-Newspaper Publication
10-Jun-2026 | Source : BSECopy of Newspaper Advertisement published in Financial Express in connection with the information related to opening of a special window for transfer and dematerialisation of physical shares which were sold/purchased prior to April 01 2019 in accordance with the relevant SEBI Circular in this regard.
Announcement Under Regulation 30 Of SEBI (LODR) Regulations 2015
05-Jun-2026 | Source : BSEThe Company is assessing the operational regulatory and financial implications of the revised SION norms and in consultation with industry bodies is considering appropriate representations with the Ministry of Commerce and Industry for reconsideration of the revised norms.
Corporate Actions

No Upcoming Board Meetings

Nitta Gelatin India Ltd has declared 20% dividend, ex-date: 25 Jul 25

No Splits history available

Nitta Gelatin India Ltd has announced 1:3 bonus issue, ex-date: 19 Jun 13

No Rights history available
Quality key factors
Valuation key factors
Technicals key factors
 Technical Indicator Scale: Bearish, Mildly Bearish, Sideways, Mildly Bullish, Bullish Turned
 Shareholding Snapshot : Mar 2026
Shareholding Compare (%holding)
Promoters
None
Held by 5 Schemes (0.01%)
Held by 0 FIIs
Nitta Gelatin Inc (42.96%)
None
20.28%
Quarterly Results Snapshot (Consolidated) - Mar'26 - QoQ

QoQ Growth in quarter ended Mar 2026 is 8.02% vs 8.44% in Dec 2025
QoQ Growth in quarter ended Mar 2026 is 33.28% vs 38.74% in Dec 2025
Half Yearly Results Snapshot (Consolidated) - Sep'25

Growth in half year ended Sep 2025 is 5.35% vs -1.97% in Sep 2024
Growth in half year ended Sep 2025 is -5.72% vs -18.31% in Sep 2024
Nine Monthly Results Snapshot (Consolidated) - Dec'25
YoY Growth in nine months ended Dec 2025 is 7.33% vs -1.22% in Dec 2024
YoY Growth in nine months ended Dec 2025 is -1.79% vs -6.38% in Dec 2024
Annual Results Snapshot (Consolidated) - Mar'26
YoY Growth in year ended Mar 2026 is 11.72% vs -1.16% in Mar 2025
YoY Growth in year ended Mar 2026 is 15.84% vs 1.57% in Mar 2025
About Nitta Gelatin India Ltd

Company Coordinates


