
Compare Nivaka Fashions with Similar Stocks
Stock DNA
Garments & Apparels
INR 8 Cr (Micro Cap)
NA (Loss Making)
21
0.00%
0.24
-118.95%
1.73
Total Returns (Price + Dividend) 
Nivaka Fashions for the last several years.
Risk Adjusted Returns v/s
Returns Beta

News
Are Nivaka Fashions Ltd latest results good or bad?
Nivaka Fashions Ltd's latest financial results for Q4 FY26 reveal a significant operational crisis, characterized by a complete collapse in revenue generation, with net sales reported at effectively zero. This stark decline from previous quarters indicates that the company has ceased business activities, raising serious concerns about its viability and going concern status. In terms of profitability, the company recorded a net loss of ₹3.61 crores, which represents a substantial deterioration compared to prior periods. The loss reflects a staggering decline in net profit of over 580% quarter-on-quarter and an alarming year-over-year drop of more than 1,600%. The operational paralysis is further highlighted by the negative operating profit before depreciation, interest, tax, and other income (PBDIT), which has reached its lowest level on record. The Return on Equity (ROE) has plummeted to a deeply negativ...
Read full news article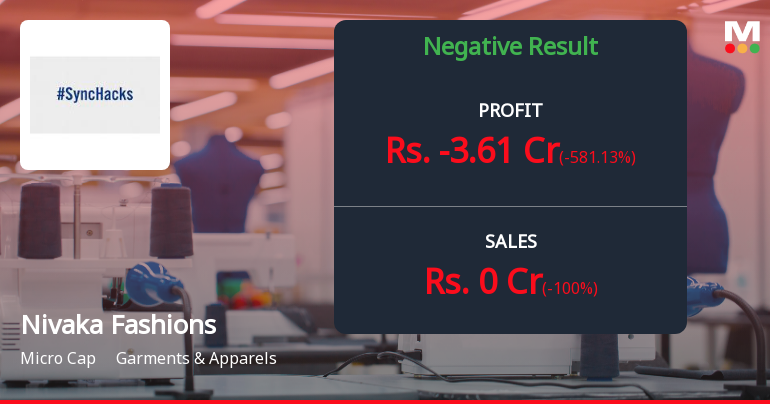
Nivaka Fashions Q4 FY26: Operations Collapse as Losses Mount to ₹3.61 Crores
Nivaka Fashions Limited, the Kolkata-based ethnic wear retailer operating under the 'Ninecolours' brand, reported a catastrophic fourth quarter for FY26, with net losses widening dramatically to ₹3.61 crores—a staggering 1,404.17% deterioration from the previous quarter's loss of ₹0.53 crores. The micro-cap company, valued at just ₹10.00 crores, saw its operations virtually grind to a halt as net sales collapsed to effectively zero during Q4 FY26, marking a complete reversal from the ₹1.30 crores recorded in Q4 FY25.
Read full news article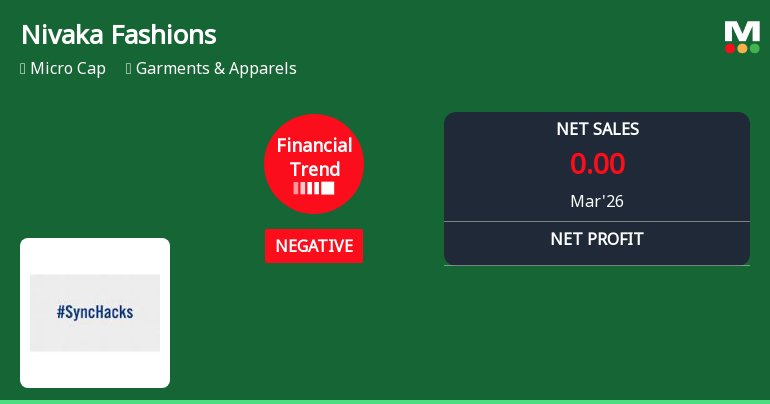
Nivaka Fashions Ltd Reports Sharp Decline in Quarterly Performance Amid Negative Financial Trend
Nivaka Fashions Ltd, a micro-cap player in the Garments & Apparels sector, has reported a significant deterioration in its financial performance for the quarter ended March 2026. The company’s financial trend has shifted from flat to negative, with key profitability metrics plunging sharply, signalling mounting challenges amid a tough market environment.
Read full news article Announcements
Announcement under Regulation 30 (LODR)-Newspaper Publication
31-May-2026 | Source : BSENewspaper Advertisement - Audited Standalone Financial Results for the quarter and year ended March 31 2026.
Announcement under Regulation 30 (LODR)-Change in Management
31-May-2026 | Source : BSEIntimation under Regulation 30 of the Securities and Exchange Board of India (Listing Obligations and Disclosure Requirements) Regulations 2015 - Appointment of Internal Auditor .
Board Meeting Outcome for Outcome Of Board Meeting Held On Saturday May 30 2026
30-May-2026 | Source : BSEPursuant to Regulations 30 and 33 of the SEBI (Listing Obligations and Disclosure Requirements) Regulations 2015 read with Schedule III of the said Regulations we inform you that the Board of Directors of the Company at its meeting held today i.e Saturday May 30 2026 inter alia has approved the following items: 1.Audited Financial Results of the Company for the quarter and year ended on 31st March 2026 along with Audit Report as enclosed below. 2.The appointment of H R Bohra and Co as the Internal Auditor of the Company for the Financial Year 2026-27.
Corporate Actions

No Upcoming Board Meetings

No Dividend history available

No Splits history available

Nivaka Fashions Ltd has announced 4:5 bonus issue, ex-date: 24 Jun 19

No Rights history available
Quality key factors
Valuation key factors
Technicals key factors
 Technical Indicator Scale: Bearish, Mildly Bearish, Sideways, Mildly Bullish, Bullish Turned
 Shareholding Snapshot : Mar 2026
Shareholding Compare (%holding)
Non Institution
None
Held by 0 Schemes
Held by 1 FIIs (4.77%)
Priyesh Shantilal Jain (14.0%)
Dulerai Prabhashankar Sompura (5.26%)
45.99%
Quarterly Results Snapshot (Standalone) - Mar'26 - QoQ

QoQ Growth in quarter ended Mar 2026 is -100.00% vs 0.00% in Dec 2025
QoQ Growth in quarter ended Mar 2026 is -581.13% vs 10.17% in Dec 2025
Half Yearly Results Snapshot (Standalone) - Sep'25
Growth in half year ended Sep 2025 is -91.67% vs -88.12% in Sep 2024

Growth in half year ended Sep 2025 is -98.15% vs -1,000.00% in Sep 2024
Nine Monthly Results Snapshot (Standalone) - Dec'25
YoY Growth in nine months ended Dec 2025 is -88.24% vs -84.55% in Dec 2024
YoY Growth in nine months ended Dec 2025 is -116.22% vs -196.00% in Dec 2024
Annual Results Snapshot (Standalone) - Mar'26
YoY Growth in year ended Mar 2026 is -98.64% vs -8.13% in Mar 2025
YoY Growth in year ended Mar 2026 is -942.00% vs -92.31% in Mar 2025
About Nivaka Fashions Ltd


