
Key Events This Week
1 June: Strong quarterly turnaround reported despite market challenges
1 June: Revenue surge masks profitability concerns in Q4 FY26 results
5 June: Stock recovers slightly with a 2.36% gain on last trading day
Jun 19, 03:30 PM
BSE+NSE Vol: 4.53 k
Trading & Distributors
INR 27 Cr (Micro Cap)
37.00
23
0.00%
1.74
26.97%
9.91
NMS Global for the last several years.

1 June: Strong quarterly turnaround reported despite market challenges
1 June: Revenue surge masks profitability concerns in Q4 FY26 results
5 June: Stock recovers slightly with a 2.36% gain on last trading day
NMS Global Ltd's latest financial results for Q4 FY26 present a complex picture characterized by significant revenue growth alongside notable challenges in profitability. The company reported net sales of ₹35.51 crores, reflecting a remarkable sequential increase of 1,917.61% from ₹1.76 crores in the previous quarter. This surge marks the highest quarterly revenue in the company's recent history, indicating strong operational momentum. However, the net profit for the same quarter was ₹0.16 crores, which, while doubling from ₹0.08 crores in Q3 FY26, represents a decline of 23.81% compared to ₹0.21 crores in Q4 FY25. This divergence between soaring revenues and declining profits highlights a concerning trend of margin compression. The operating profit margin (excluding other income) fell sharply to 2.03% from 23.86% in the prior quarter, and the profit after tax (PAT) margin dropped to 0.45% from 4.55%. Such...
Read full news article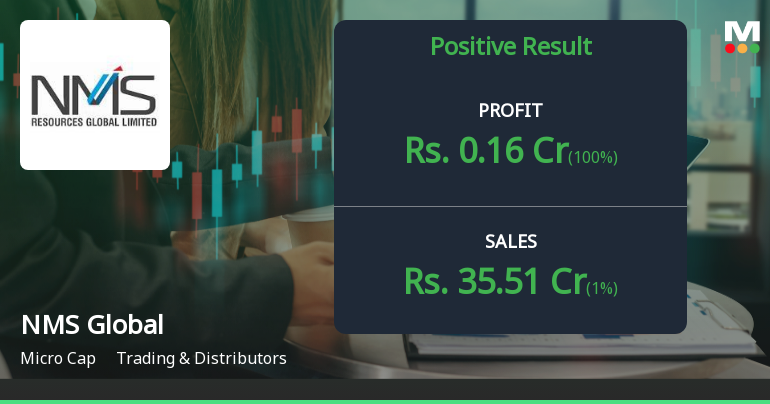
NMS Resources Global Ltd., a micro-cap trading and distribution company with a market capitalisation of ₹27.47 crores, reported a dramatic revenue surge in Q4 FY26, with net sales skyrocketing to ₹35.51 crores—a staggering 1,917.61% quarter-on-quarter increase and 829.58% year-on-year growth. However, this exceptional topline expansion failed to translate into proportionate bottom-line growth, raising questions about margin sustainability and operational efficiency.
Read full news articleDisclosure
Statement of Material Change in EGM Notice held on February 28 2026
Newspaper publication

No Upcoming Board Meetings

No Dividend history available

No Splits history available

No Bonus history available

No Rights history available
 Technical Indicator Scale: Bearish, Mildly Bearish, Sideways, Mildly Bullish, Bullish Turned
 Non Institution
None
Held by 0 Schemes
Held by 0 FIIs
Ompal Yadav (28.04%)
Kabir Ventures Llp (6.67%)
42.8%

QoQ Growth in quarter ended Mar 2026 is 1,917.61% vs -38.68% in Dec 2025
QoQ Growth in quarter ended Mar 2026 is 100.00% vs -78.38% in Dec 2025
Growth in half year ended Sep 2025 is -13.61% vs -21.88% in Sep 2024
Growth in half year ended Sep 2025 is 152.63% vs -48.65% in Sep 2024
YoY Growth in nine months ended Dec 2025 is -26.70% vs -41.85% in Dec 2024
YoY Growth in nine months ended Dec 2025 is 100.00% vs -70.53% in Dec 2024
YoY Growth in year ended Mar 2026 is 212.74% vs -44.99% in Mar 2025
YoY Growth in year ended Mar 2026 is 75.61% vs 24.24% in Mar 2025


