
Compare Norben Tea with Similar Stocks
Dashboard
With a Operating Losses, the company has a Weak Long Term Fundamental Strength
- Low ability to service debt as the company has a high Debt to EBITDA ratio of 8.59 times
- The company has been able to generate a Return on Equity (avg) of 0.72% signifying low profitability per unit of shareholders funds
Flat results in Mar 26
With ROCE of 0.9, it has a Very Expensive valuation with a 4.5 Enterprise value to Capital Employed
Total Returns (Price + Dividend) 
Norben Tea for the last several years.
Risk Adjusted Returns v/s
Returns Beta

News
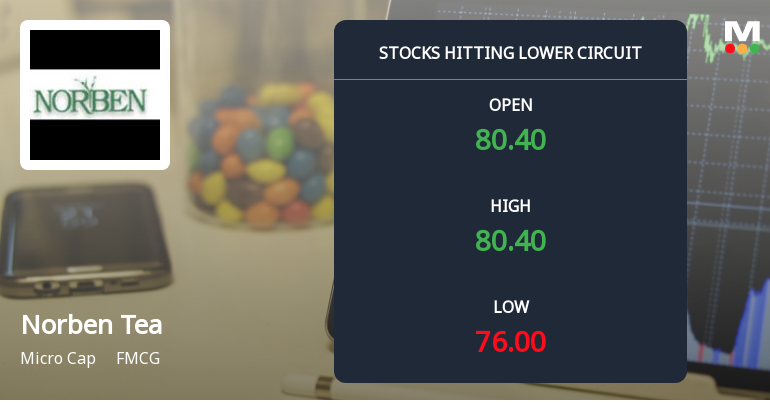
Norben Tea & Exports Ltd Locks at Lower Circuit With 4.62% Loss — Sellers Queue, No Buyers in Sight
At Rs 78.50, sellers were still queuing — but there were no buyers willing to take the other side. Norben Tea & Exports Ltd locked at its lower circuit of 5% on 4 Jun 2026, with unfilled sell orders and a frozen price, signalling persistent selling pressure in a micro-cap stock with limited liquidity.
Read full news article
Norben Tea & Exports Ltd Downgraded to Strong Sell Amidst Weak Financials and Expensive Valuation
Norben Tea & Exports Ltd has been downgraded from a Sell to a Strong Sell rating as of 2 June 2026, reflecting deteriorating fundamentals and valuation concerns despite recent stock price gains. The micro-cap FMCG company’s flat financial performance in Q4 FY25-26, coupled with high leverage and weak profitability metrics, has prompted a reassessment across key investment parameters including quality, valuation, financial trend, and technicals.
Read full news article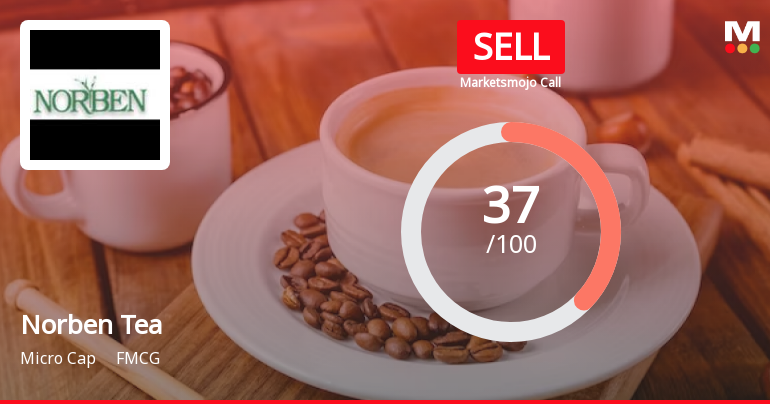
Norben Tea & Exports Ltd is Rated Sell
Norben Tea & Exports Ltd is rated 'Sell' by MarketsMOJO, with this rating last updated on 23 June 2025. However, the analysis and financial metrics discussed here reflect the stock's current position as of 02 June 2026, providing investors with an up-to-date perspective on the company’s performance and outlook.
Read full news article Announcements
Announcement under Regulation 30 (LODR)-Newspaper Publication
09-Jun-2026 | Source : BSENewspaper Publication- Pre- Dispatch Notice of the 36th AGM
Compliances-Reg.24(A)-Annual Secretarial Compliance
28-May-2026 | Source : BSEPlease Find the enclosed the Annual Secretarial Compliance Report for the year ended 31st March 2026.
Announcement under Regulation 30 (LODR)-Newspaper Publication
27-May-2026 | Source : BSENewspaper Publication in respect of the Audited Standalone Financial Results of the Company For the Quarter and Financial Year ended 31st March 2026.
Corporate Actions

No Upcoming Board Meetings

No Dividend history available

No Splits history available

No Bonus history available

No Rights history available
Quality key factors
Valuation key factors
Technicals key factors
 Technical Indicator Scale: Bearish, Mildly Bearish, Sideways, Mildly Bullish, Bullish Turned
 Shareholding Snapshot : Mar 2026
Shareholding Compare (%holding)
Non Institution
None
Held by 3 Schemes (0.09%)
Held by 0 FIIs
Tongani Tea Company Ltd (14.54%)
Kailash Dhanuka Huf (4.99%)
49.76%
Quarterly Results Snapshot (Standalone) - Mar'26 - QoQ

QoQ Growth in quarter ended Mar 2026 is -52.65% vs 26.36% in Dec 2025
QoQ Growth in quarter ended Mar 2026 is -977.78% vs -18.18% in Dec 2025
Half Yearly Results Snapshot (Standalone) - Sep'25
Growth in half year ended Sep 2025 is -20.44% vs 14.04% in Sep 2024
Growth in half year ended Sep 2025 is -60.00% vs 25.00% in Sep 2024
Nine Monthly Results Snapshot (Standalone) - Dec'25
YoY Growth in nine months ended Dec 2025 is 1.07% vs 21.89% in Dec 2024
YoY Growth in nine months ended Dec 2025 is -42.35% vs 226.87% in Dec 2024
Annual Results Snapshot (Standalone) - Mar'26
YoY Growth in year ended Mar 2026 is 5.49% vs 16.26% in Mar 2025
YoY Growth in year ended Mar 2026 is -61.11% vs 89.41% in Mar 2025
About Norben Tea & Exports Ltd

Company Coordinates


