
Compare Nordic American Tankers Ltd. with Similar Stocks
Dashboard
1
Poor Management Efficiency with a low ROCE of 7.18%
- The company has been able to generate a Return on Capital Employed (avg) of 7.18% signifying low profitability per unit of total capital (equity and debt)
2
Poor long term growth as Net Sales has grown by an annual rate of -3.59% over the last 5 years
3
With a fall in Net Sales of -16.39%, the company declared Very Negative results in Jun 25
Total Returns (Price + Dividend) 
TimePeriod
Price Return
Dividend Return
Total Return
3 Months
72.02%
0%
72.02%
6 Months
55.97%
0%
55.97%
1 Year
3.72%
0%
3.72%
2 Years
12.37%
0%
12.37%
3 Years
100.96%
0%
100.96%
4 Years
17.75%
0%
17.75%
5 Years
-19.62%
0%
-19.62%
Nordic American Tankers Ltd. for the last several years.
Risk Adjusted Returns v/s
News
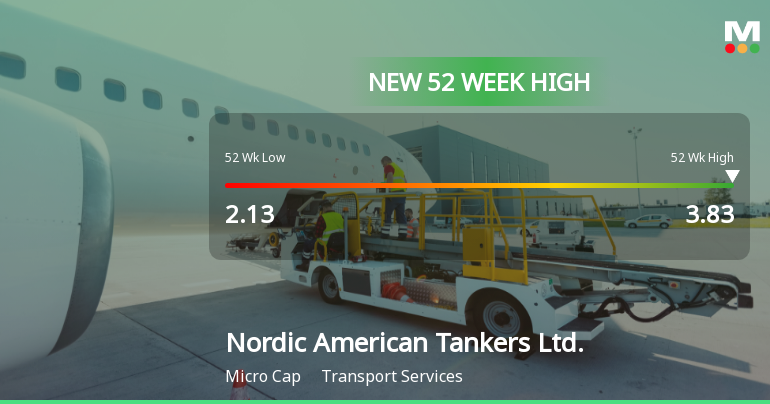
Nordic American Tankers Hits New 52-Week High of USD 3.83
Nordic American Tankers achieved a new 52-week high of USD 3.83 on November 17, 2025, despite a one-year decline of 5.21%. The company, with a market cap of USD 688 million, has a P/E ratio of 16.00 and a notable dividend yield of 697.98%.
Read full news article Announcements

No announcement available
Corporate Actions
No corporate action available
Quality key factors
Factor
Value
Sales Growth (5y)
-3.59%
EBIT Growth (5y)
-26.40%
EBIT to Interest (avg)
1.20
Debt to EBITDA (avg)
2.22
Net Debt to Equity (avg)
0.47
Sales to Capital Employed (avg)
0.41
Tax Ratio
0
Dividend Payout Ratio
180.02%
Pledged Shares
0
Institutional Holding
51.87%
ROCE (avg)
7.18%
ROE (avg)
7.12%
Valuation key factors
Factor
Value
P/E Ratio
16
Industry P/E
Price to Book Value
1.16
EV to EBIT
14.74
EV to EBITDA
7.39
EV to Capital Employed
1.11
EV to Sales
2.57
PEG Ratio
NA
Dividend Yield
1004.14%
ROCE (Latest)
7.54%
ROE (Latest)
7.16%
Technicals key factors
Indicator
Weekly
Monthly
MACD
Bullish
Bullish
RSI
No Signal
No Signal
Bollinger Bands
Bullish
Bullish
Moving Averages
Bullish (Daily)
KST
Mildly Bearish
Bullish
Dow Theory
Mildly Bullish
No Trend
OBV
No Trend
No Trend
 Technical Indicator Scale: Bearish, Mildly Bearish, Sideways, Mildly Bullish, Bullish Turned
 Shareholding Snapshot : Sep 2025
Shareholding Compare (%holding)
Majority shareholders
Domestic Funds
Domestic Funds
Held in 32 Schemes (19.62%)
Foreign Institutions
Held by 55 Foreign Institutions (6.92%)
Strategic Entities with highest holding
Highest Public shareholder
Quarterly Results Snapshot (Consolidated) - Sep'25 - QoQ
Sep'25
Jun'25
Change(%)
Net Sales
75.00
66.70
12.44%
Operating Profit (PBDIT) excl Other Income
22.10
15.40
43.51%
Interest
9.80
9.20
6.52%
Exceptional Items
0.00
0.00
Consolidate Net Profit
-2.80
-0.90
-211.11%
Operating Profit Margin (Excl OI)
90.50%
6.50%
8.40%
USD in Million.

Net Sales
QoQ Growth in quarter ended Sep 2025 is 12.44% vs 2.93% in Jun 2025

Consolidated Net Profit
QoQ Growth in quarter ended Sep 2025 is -211.11% vs -121.43% in Jun 2025
Annual Results Snapshot (Consolidated) - Dec'24
Dec'24
Dec'23
Change(%)
Net Sales
349.70
391.70
-10.72%
Operating Profit (PBDIT) excl Other Income
133.50
179.30
-25.54%
Interest
30.70
30.50
0.66%
Exceptional Items
0.00
0.00
Consolidate Net Profit
46.60
98.70
-52.79%
Operating Profit Margin (Excl OI)
221.10%
326.50%
-10.54%
USD in Million.
Net Sales
YoY Growth in year ended Dec 2024 is -10.72% vs 15.44% in Dec 2023
Consolidated Net Profit
YoY Growth in year ended Dec 2024 is -52.79% vs 553.64% in Dec 2023
About Nordic American Tankers Ltd.

Nordic American Tankers Ltd.
Transport Services
Nordic American Tankers Limited is an international tanker company. The Company owns approximately 26 vessels, including approximately two new buildings under construction, of approximately 156,000 deadweight tonnage (dwt) each. The Company's Suezmaxes tankers can carry over one million barrels of oil. The vessels in the Company's fleet are homogenous and interchangeable. The Company's vessels are employed in the spot market. The Company's vessels include Nordic Harrier, Nordic Hawk, Nordic Hunter, Nordic Voyager, Nordic Fighter, Nordic Freedom, Nordic Discovery, Nordic Saturn, Nordic Jupiter, Nordic Moon, Nordic Apollo, Nordic Cosmos, Nordic Sprite, Nordic Mistral, Nordic Passat, Nordic Vega, Nordic Breeze, Nordic Zenith, Nordic Sprinter, Nordic Skier and Nordic Light.
Company Coordinates
Company Details
Lom Building, 27 Reid Street , HAMILTON None : HM 11


Registrar Details
InfinHub Market Technologies FZ-LLC, Building-2, Unit 112, Dubai Internet City, Dubai, United Arab Emirates
GET THE MARKETSMOJO APP


Company
Stocks
Portfolio


"Investment in securities markets are subject to market risk. Read all the related documents carefully before investing."