
Compare North Eastn.Car. with Similar Stocks
Dashboard
Weak Long Term Fundamental Strength with an average Return on Capital Employed (ROCE) of 6.64%
- Poor long term growth as Net Sales has grown by an annual rate of 5.96% and Operating profit at 18.41% over the last 5 years
- Low ability to service debt as the company has a high Debt to EBITDA ratio of 6.91 times
Negative results in Mar 26
Consistent Underperformance against the benchmark over the last 3 years
Stock DNA
Transport Services
INR 173 Cr (Micro Cap)
22.00
37
0.00%
0.48
3.43%
0.77
Total Returns (Price + Dividend) 
North Eastn.Car. for the last several years.
Risk Adjusted Returns v/s
Returns Beta

News

North Eastern Carrying Corporation Ltd is Rated Strong Sell
North Eastern Carrying Corporation Ltd is rated Strong Sell by MarketsMOJO. This rating was last updated on 30 May 2026, reflecting a shift from the previous 'Sell' grade. However, all fundamentals, returns, and financial metrics discussed here are current as of 24 June 2026, providing investors with the latest comprehensive view of the stock's position.
Read full news article
North Eastern Carrying Corporation Ltd is Rated Strong Sell
North Eastern Carrying Corporation Ltd is rated Strong Sell by MarketsMOJO. This rating was last updated on 30 May 2026. However, all fundamentals, returns, and financial metrics discussed here reflect the company’s current position as of 12 June 2026, providing investors with the most recent and relevant analysis.
Read full news article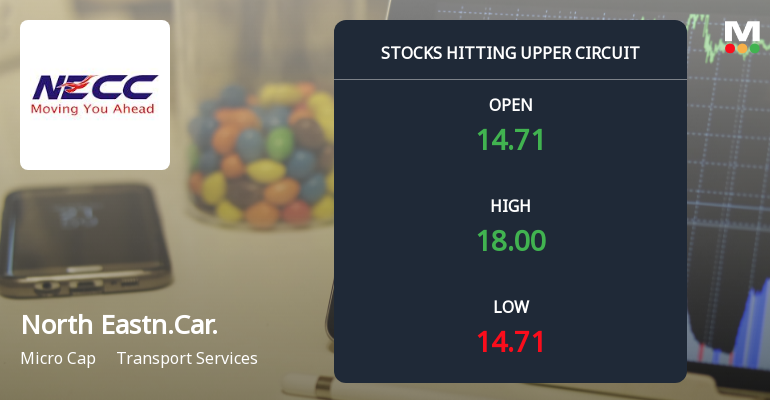
North Eastern Carrying Corporation Ltd Locks at Upper Circuit With 17.39% Gain — Buyers Queue, Sellers Absent
At Rs 18.01, the buying was done — not because demand dried up, but because the exchange wouldn't let the stock go any higher. North Eastern Carrying Corporation Ltd locked at its upper circuit of 17.39% on 10 Jun 2026, with buyers queuing and no sellers willing to part with shares.
Read full news article Announcements
Change In Corporate Identification Number (CIN) Of The Company
12-Jun-2026 | Source : BSEWe wish to inform you that the Registrar of Companies has update/revise the Corporate Identification Number (CIN) of the Company from L51909DL1984PLC019485 (old) to L49231DL1984PLC019485 (New). Kindly take the above information on record.
Disclosures under Reg. 29(2) of SEBI (SAST) Regulations 2011
08-Jun-2026 | Source : BSEThe Exchange has received the disclosure under Regulation 29(2) of SEBI (Substantial Acquisition of Shares & Takeovers) Regulations 2011 for Sunil Kumar Jain
Disclosure Under Regulation 7(2) Of SEBI (PIT) Regulations 2015
08-Jun-2026 | Source : BSEWe are submitted herewith the disclosure received from Mr. Sunil Kumar Jain under Regulations 7(2)(a) of SEBI(PIT) Regulation 2015 regarding acquisition/allotment of 4500000 Equity shares of the Company on preferential basis.
Corporate Actions

No Upcoming Board Meetings

No Dividend history available

No Splits history available

North Eastern Carrying Corporation Ltd has announced 3:1 bonus issue, ex-date: 15 Nov 12

North Eastern Carrying Corporation Ltd has announced 9:10 rights issue, ex-date: 02 Jun 23
Quality key factors
Valuation key factors
Technicals key factors
 Technical Indicator Scale: Bearish, Mildly Bearish, Sideways, Mildly Bullish, Bullish Turned
 Shareholding Snapshot : Jun 2026
Shareholding Compare (%holding)
Promoters
10.3928
Held by 0 Schemes
Held by 0 FIIs
Necc Automobiles Private Limited (15.15%)
Religare Finvest Ltd (5.78%)
29.27%
Quarterly Results Snapshot (Standalone) - Mar'26 - QoQ

QoQ Growth in quarter ended Mar 2026 is 33.71% vs 1.72% in Dec 2025

QoQ Growth in quarter ended Mar 2026 is -79.71% vs 89.56% in Dec 2025
Half Yearly Results Snapshot (Standalone) - Sep'25
Growth in half year ended Sep 2025 is -12.36% vs 1.20% in Sep 2024
Growth in half year ended Sep 2025 is -45.04% vs 148.11% in Sep 2024
Nine Monthly Results Snapshot (Standalone) - Dec'25
YoY Growth in nine months ended Dec 2025 is -11.97% vs -1.09% in Dec 2024
YoY Growth in nine months ended Dec 2025 is -16.96% vs 64.53% in Dec 2024
Annual Results Snapshot (Standalone) - Mar'26
YoY Growth in year ended Mar 2026 is -6.29% vs -1.91% in Mar 2025
YoY Growth in year ended Mar 2026 is -24.39% vs 27.81% in Mar 2025
About North Eastern Carrying Corporation Ltd

Company Coordinates


