
Compare North Eastn.Car. with Similar Stocks
Dashboard
Weak Long Term Fundamental Strength with an average Return on Capital Employed (ROCE) of 6.64%
- Poor long term growth as Net Sales has grown by an annual rate of 5.96% and Operating profit at 18.41% over the last 5 years
- Low ability to service debt as the company has a high Debt to EBITDA ratio of 6.91 times
Negative results in Mar 26
Below par performance in long term as well as near term
Stock DNA
Transport Services
INR 167 Cr (Micro Cap)
21.00
39
0.00%
0.48
3.43%
0.72
Total Returns (Price + Dividend) 
North Eastn.Car. for the last several years.
Risk Adjusted Returns v/s
Returns Beta

News

North Eastern Carrying Corporation Ltd is Rated Strong Sell
North Eastern Carrying Corporation Ltd is rated Strong Sell by MarketsMOJO. This rating was last updated on 30 May 2026, reflecting a shift from the previous 'Sell' grade. However, the analysis and financial metrics presented here are based on the stock's current position as of 16 July 2026, providing investors with the latest insights into the company’s performance and outlook.
Read full news article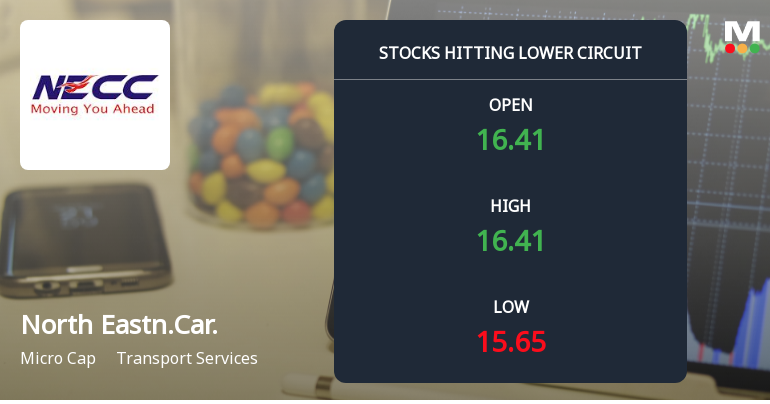
Below All Moving Averages and Now at Lower Circuit: North Eastern Carrying Corporation Ltd Loses 1.12% in a Single Session
At Rs 15.28, sellers were still queuing — but there were no buyers willing to take the other side. North Eastern Carrying Corporation Ltd locked at its lower circuit of 5% on 13 Jul 2026, with unfilled sell orders and a frozen price, signalling persistent selling pressure in a micro-cap stock with limited liquidity.
Read full news article
North Eastern Carrying Corporation Ltd Locks at Upper Circuit With 3.05% Gain — Buyers Queue, Sellers Absent
At Rs 16.86, the buying was done — not because demand dried up, but because the exchange wouldn't let the stock go any higher. North Eastern Carrying Corporation Ltd locked at its upper circuit of 3.05% on 7 Jul 2026, with buyers queuing and no sellers willing to part with shares.
Read full news article Announcements
North Eastern Carrying Corporation Limited - Other General Purpose
21-Nov-2019 | Source : NSENorth Eastern Carrying Corporation Limited has informed the Exchange regarding Related Party Transaction disclosure under Regulation 23(9) of the SEBI (Listing Obligations and Disclosure Requirements) Regulations, 2015.
Reply to Clarification- Financial results
19-Sep-2019 | Source : NSE
| The Exchange had sought clarification from North Eastern Carrying Corporation Limited for the quarter ended 30-Jun-2019 with respect to Regulation 33 of the SEBI (Listing Obligations and Disclosure Requirements) Regulations, 2015. On basis of above the Company was required to clarify the following: -1. Limited Review Report/ Independent Auditor's Report is not in the format prescribed by SEBI The response of the Company is enclosed. |
AGM\/Book Closure
09-Sep-2019 | Source : NSE
| North Eastern Carrying Corporation Limited has informed the Exchange that the Register of Members and the Share Transfer Books will remain closed from????September 24, 2019 to September 30, 2019 ( both days inclusive)?? for the purpose of Annual General Meeting to be held on September 30, 2019. |
Corporate Actions

No Upcoming Board Meetings

No Dividend history available

No Splits history available

North Eastern Carrying Corporation Ltd has announced 3:1 bonus issue, ex-date: 15 Nov 12

North Eastern Carrying Corporation Ltd has announced 9:10 rights issue, ex-date: 02 Jun 23
Quality key factors
Valuation key factors
Technicals key factors
 Technical Indicator Scale: Bearish, Mildly Bearish, Sideways, Mildly Bullish, Bullish Turned
 Shareholding Snapshot : Jun 2026
Shareholding Compare (%holding)
Promoters
10.3928
Held by 0 Schemes
Held by 0 FIIs
Necc Automobiles Private Limited (15.15%)
Religare Finvest Ltd (5.78%)
29.23%
Quarterly Results Snapshot (Standalone) - Mar'26 - QoQ

QoQ Growth in quarter ended Mar 2026 is 33.71% vs 1.72% in Dec 2025

QoQ Growth in quarter ended Mar 2026 is -79.71% vs 89.56% in Dec 2025
Half Yearly Results Snapshot (Standalone) - Sep'25
Growth in half year ended Sep 2025 is -12.36% vs 1.20% in Sep 2024
Growth in half year ended Sep 2025 is -45.04% vs 148.11% in Sep 2024
Nine Monthly Results Snapshot (Standalone) - Dec'25
YoY Growth in nine months ended Dec 2025 is -11.97% vs -1.09% in Dec 2024
YoY Growth in nine months ended Dec 2025 is -16.96% vs 64.53% in Dec 2024
Annual Results Snapshot (Standalone) - Mar'26
YoY Growth in year ended Mar 2026 is -6.29% vs -1.91% in Mar 2025
YoY Growth in year ended Mar 2026 is -24.39% vs 27.81% in Mar 2025
About North Eastern Carrying Corporation Ltd

Company Coordinates


