
Compare Nouveau Global with Similar Stocks
Dashboard
With a Negative Book Value, the company has a Weak Long Term Fundamental Strength
- Poor long term growth as Net Sales has grown by an annual rate of -7.15% and Operating profit at 0% over the last 5 years
- The company has a negative book value of Rs 0.01 crore
Flat results in Mar 26
Risky - Negative EBITDA
Stock DNA
Trading & Distributors
INR 5 Cr (Micro Cap)
NA (Loss Making)
26
0.00%
-8.80
40.00%
-4.82
Total Returns (Price + Dividend) 
Nouveau Global for the last several years.
Risk Adjusted Returns v/s
Returns Beta

News

Nouveau Global Ventures Ltd Falls to 52-Week Low of Rs 0.24 as Sell-Off Deepens
For the fifth consecutive session, Nouveau Global Ventures Ltd has closed lower, slipping to a fresh 52-week low of Rs 0.24 on 6 Jul 2026. This marks a 17.24% decline over the past five days, extending the stock’s downward trajectory amid a broader market rally.
Read full news article
Nouveau Global Ventures Ltd Falls to 52-Week Low of Rs 0.25 as Sell-Off Deepens
For the fourth consecutive session, Nouveau Global Ventures Ltd has seen its share price decline, culminating in a fresh 52-week low of Rs 0.25 on 3 Jul 2026. This marks a 50% drop from its 52-week high of Rs 0.50, underscoring sustained selling pressure despite broader market gains.
Read full news article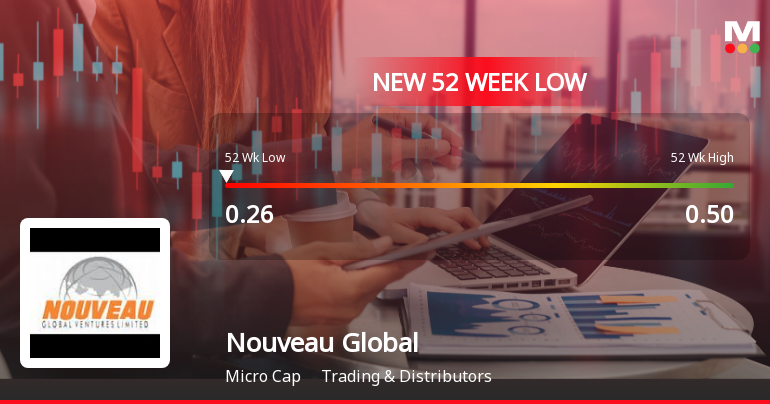
Nouveau Global Ventures Ltd Falls to 52-Week Low of Rs 0.26 as Sell-Off Deepens
For the third consecutive session, Nouveau Global Ventures Ltd has seen its share price decline, culminating in a fresh 52-week low of Rs 0.26 on 2 Jul 2026. This marks a significant 48% drop from its 52-week high of Rs 0.50, underscoring persistent selling pressure amid a broader market that remains resilient.
Read full news article Announcements
Compliances-Certificate under Reg. 74 (5) of SEBI (DP) Regulations 2018
09-Jul-2026 | Source : BSEPlease find enclosed the certificate for the captioned subject.
Closure of Trading Window
25-Jun-2026 | Source : BSEPlease find attached herewith intimation regarding closure of trading window of company from 1st july till the 48 hours from declaration of unaudited financial result for the first quarter ended June 30 2026
Intimation Under Regulation 30 And Other Applicable Regulations Of Securities And Exchange Board Of India (Listing Obligations And Disclosure Requirements) Regulations 2015 (SEBI LODR 2015)- Execution Of Loan Agreement
15-Jun-2026 | Source : BSEPlease find enclosed the outcome of the board meeting held today.
Corporate Actions

No Upcoming Board Meetings

No Dividend history available

Nouveau Global Ventures Ltd has announced 1:10 stock split, ex-date: 07 Mar 22

No Bonus history available

Nouveau Global Ventures Ltd has announced 3:2 rights issue, ex-date: 14 Jul 09
Quality key factors
Valuation key factors
Technicals key factors
 Technical Indicator Scale: Bearish, Mildly Bearish, Sideways, Mildly Bullish, Bullish Turned
 Shareholding Snapshot : Jun 2026
Shareholding Compare (%holding)
Non Institution
None
Held by 0 Schemes
Held by 0 FIIs
Kasturi Overseas Private Limited (7.4%)
Nirnidhi Consultant Pvt. Ltd. (3.84%)
33.9%
Quarterly Results Snapshot (Standalone) - Mar'26 - YoY
YoY Growth in quarter ended Mar 2026 is 0.00% vs 0.00% in Mar 2025

YoY Growth in quarter ended Mar 2026 is -9.09% vs -57.14% in Mar 2025
Half Yearly Results Snapshot (Standalone) - Sep'25
Growth in half year ended Sep 2025 is 0.00% vs 0.00% in Sep 2024

Growth in half year ended Sep 2025 is -114.81% vs 515.38% in Sep 2024
Nine Monthly Results Snapshot (Standalone) - Dec'25
YoY Growth in nine months ended Dec 2025 is 0.00% vs 0.00% in Dec 2024
YoY Growth in nine months ended Dec 2025 is -141.18% vs 553.33% in Dec 2024
Annual Results Snapshot (Standalone) - Mar'26
YoY Growth in year ended Mar 2026 is 0.00% vs 0.00% in Mar 2025
YoY Growth in year ended Mar 2026 is -170.18% vs 359.09% in Mar 2025
About Nouveau Global Ventures Ltd

Company Coordinates


