
Compare Nova Agritech with Similar Stocks
Total Returns (Price + Dividend) 
Nova Agritech for the last several years.
Risk Adjusted Returns v/s
Returns Beta

News

Nova Agritech Ltd is Rated Sell
Nova Agritech Ltd is rated Sell by MarketsMOJO, with this rating last updated on 15 Apr 2026. However, the analysis and financial metrics discussed here reflect the company’s current position as of 11 June 2026, providing investors with an up-to-date view of the stock’s fundamentals, returns, and technical outlook.
Read full news articleAre Nova Agritech Ltd latest results good or bad?
The latest financial results for Nova Agritech Ltd for Q4 FY26 reveal significant operational challenges. The company reported a net profit of ₹0.22 crores, which represents a dramatic decline of 96.21% year-on-year. Revenue also fell sharply to ₹55.91 crores, marking a 31.26% contraction compared to the same quarter last year and a sequential decline of 15.99% from the previous quarter. Operating margins compressed to 6.35%, the lowest level in eight quarters, down from 11.77% in the prior year. This margin compression indicates difficulties in maintaining pricing power and operational efficiency. Additionally, the profit after tax margin dropped to 0.39%, a significant decrease from 7.14% year-on-year, further highlighting the company's struggles. The data indicates that the company's operational performance is under pressure, with multiple quarters of declining sales and profitability metrics. The bal...
Read full news article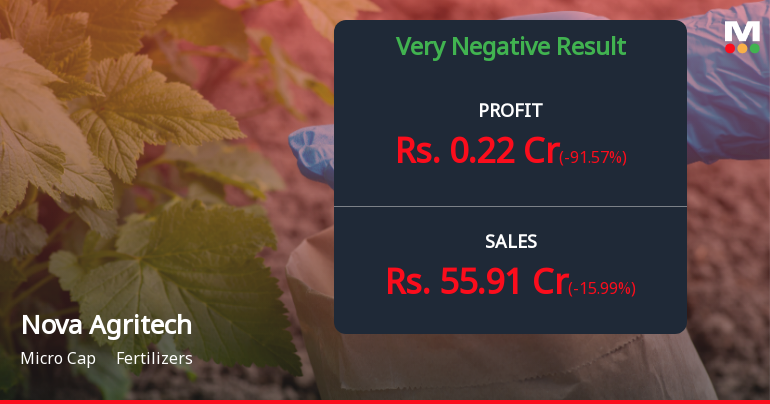
Nova Agritech Q4 FY26: Profit Plummets 96% as Margin Pressures Mount
Nova Agritech Ltd., a micro-cap fertiliser manufacturer with a market capitalisation of ₹261.00 crores, reported a devastating fourth quarter for FY26, with net profit collapsing 96.21% year-on-year to just ₹0.22 crores from ₹5.81 crores in the corresponding quarter last year. The sequential decline was equally alarming, with profits plunging 91.57% from ₹2.61 crores in Q3 FY26, marking the company's weakest quarterly performance in recent history.
Read full news article Announcements
Announcement under Regulation 30 (LODR)-Newspaper Publication
01-Jun-2026 | Source : BSENewspaper Advertisement after Board meeting
Board Meeting Outcome for Outcome Of Board Meeting
30-May-2026 | Source : BSEApproval of Audited Financial Results for the Period ended 31.03.2026
Re-Appointment Of Internal & Cost Auditor
30-May-2026 | Source : BSERe-appointment of Internal & Cost Auditor
Corporate Actions

No Upcoming Board Meetings

No Dividend history available

No Splits history available

No Bonus history available

No Rights history available
Quality key factors
Valuation key factors
Technicals key factors
 Technical Indicator Scale: Bearish, Mildly Bearish, Sideways, Mildly Bullish, Bullish Turned
 Shareholding Snapshot : Mar 2026
Shareholding Compare (%holding)
Promoters
None
Held by 0 Schemes
Held by 2 FIIs (0.19%)
Yeluri Family Trust (malathi Siripurapu) (33.65%)
Quantum-state Investment Fund (1.24%)
33.35%
Quarterly Results Snapshot (Consolidated) - Mar'26 - QoQ

QoQ Growth in quarter ended Mar 2026 is -15.99% vs -27.97% in Dec 2025

QoQ Growth in quarter ended Mar 2026 is -91.57% vs -61.39% in Dec 2025
Half Yearly Results Snapshot (Consolidated) - Sep'25
Growth in half year ended Sep 2025 is 11.66% vs 20.71% in Sep 2024
Growth in half year ended Sep 2025 is -9.41% vs 6.45% in Sep 2024
Nine Monthly Results Snapshot (Consolidated) - Dec'25
YoY Growth in nine months ended Dec 2025 is -3.34% vs 17.11% in Dec 2024
YoY Growth in nine months ended Dec 2025 is -41.60% vs 7.94% in Dec 2024
Annual Results Snapshot (Consolidated) - Mar'26
YoY Growth in year ended Mar 2026 is -11.06% vs 16.50% in Mar 2025
YoY Growth in year ended Mar 2026 is -53.17% vs -3.14% in Mar 2025
About Nova Agritech Ltd

Company Coordinates


