
Compare Novelix Pharma. with Similar Stocks
Dashboard
Poor Management Efficiency with a low ROE of 0.76%
- The company has been able to generate a Return on Equity (avg) of 0.76% signifying low profitability per unit of shareholders funds
Low ability to service debt as the company has a high Debt to EBITDA ratio of -0.40 times
Healthy long term growth as Net Sales has grown by an annual rate of 157.44%
The company has declared Positive results for the last 4 consecutive quarters
With ROE of 10, it has a Expensive valuation with a 7.4 Price to Book Value
Total Returns (Price + Dividend) 
Latest dividend: 0.3 per share ex-dividend date: Aug-16-2012
Risk Adjusted Returns v/s
Returns Beta

News
Novelix Pharmaceuticals Ltd is Rated Hold
Novelix Pharmaceuticals Ltd is rated 'Hold' by MarketsMOJO, with this rating last updated on 13 February 2026. However, the analysis and financial metrics discussed here reflect the stock's current position as of 16 July 2026, providing investors with an up-to-date perspective on the company’s performance and outlook.
Read full news article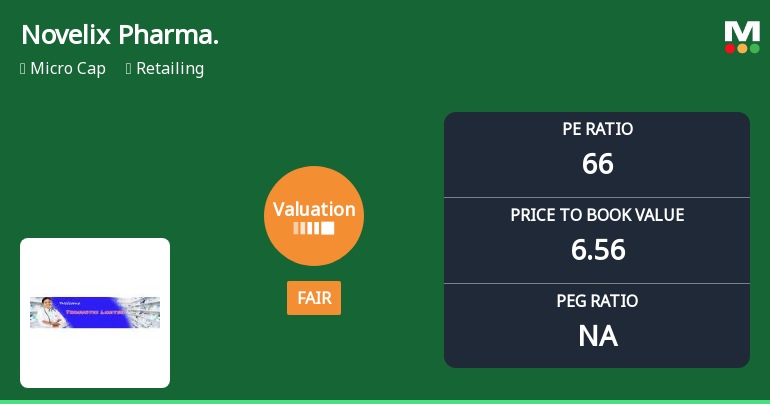
Novelix Pharmaceuticals Ltd Valuation Shifts Signal Renewed Price Attractiveness
Novelix Pharmaceuticals Ltd has witnessed a notable shift in its valuation parameters, moving from an expensive to a fair valuation grade, reflecting a changing investor sentiment amid mixed market signals. Despite a recent 4.01% dip in its share price, the company’s price-to-earnings (P/E) and price-to-book value (P/BV) ratios suggest a more attractive entry point compared to its historical highs and peer group averages.
Read full news article
Novelix Pharmaceuticals Ltd is Rated Hold
Novelix Pharmaceuticals Ltd is rated 'Hold' by MarketsMOJO, with this rating last updated on 13 February 2026. However, the analysis and financial metrics discussed here reflect the stock's current position as of 05 July 2026, providing investors with an up-to-date view of the company’s fundamentals, returns, and market performance.
Read full news article Announcements
Compliances-Certificate under Reg. 74 (5) of SEBI (DP) Regulations 2018
16-Jul-2026 | Source : BSESubmission of Certificate under Reg. 74(5) of SEBI (DP) Regulations 2018
Disclosures under Reg. 29(2) of SEBI (SAST) Regulations 2011
13-Jul-2026 | Source : BSEThe Exchange has received the disclosure under Regulation 29(2) of SEBI (Substantial Acquisition of Shares & Takeovers) Regulations 2011 for Srinidhi Fine - Chemicals LLP & Others
Announcement under Regulation 30 (LODR)-Code of Conduct under SEBI (PIT) Regulations 2015
13-Jul-2026 | Source : BSESubmission of Intimation under regulation 7(2) of SEBI (PIT) Regulations 2015.
Corporate Actions

No Upcoming Board Meetings

Novelix Pharmaceuticals Ltd has declared 3% dividend, ex-date: 16 Aug 12

Novelix Pharmaceuticals Ltd has announced 10:1 stock split, ex-date: 04 Oct 10

No Bonus history available

No Rights history available
Quality key factors
Valuation key factors
Technicals key factors
 Technical Indicator Scale: Bearish, Mildly Bearish, Sideways, Mildly Bullish, Bullish Turned
 Shareholding Snapshot : Jun 2026
Shareholding Compare (%holding)
Promoters
None
Held by 0 Schemes
Held by 0 FIIs
Srinidhi Fine-chemicals Llp (33.07%)
Mallela Venkatramna Reddy (7.66%)
45.8%
Quarterly Results Snapshot (Standalone) - Mar'26 - QoQ

QoQ Growth in quarter ended Mar 2026 is -47.95% vs 33.11% in Dec 2025
QoQ Growth in quarter ended Mar 2026 is -9.00% vs 88.68% in Dec 2025
Half Yearly Results Snapshot (Standalone) - Sep'25

Growth in half year ended Sep 2025 is 1,187.50% vs 58.33% in Sep 2024
Growth in half year ended Sep 2025 is 390.91% vs 8.33% in Sep 2024
Nine Monthly Results Snapshot (Standalone) - Dec'25
YoY Growth in nine months ended Dec 2025 is 986.31% vs 191.72% in Dec 2024
YoY Growth in nine months ended Dec 2025 is 2,442.86% vs 74.07% in Dec 2024
Annual Results Snapshot (Standalone) - Mar'26
YoY Growth in year ended Mar 2026 is 330.70% vs 627.96% in Mar 2025
YoY Growth in year ended Mar 2026 is 3,100.00% vs 700.00% in Mar 2025
About Novelix Pharmaceuticals Ltd

Company Coordinates


