
Compare Novelix Pharma. with Similar Stocks
Dashboard
Poor Management Efficiency with a low ROE of 0.76%
- The company has been able to generate a Return on Equity (avg) of 0.76% signifying low profitability per unit of shareholders funds
Low ability to service debt as the company has a high Debt to EBITDA ratio of -0.40 times
Healthy long term growth as Net Sales has grown by an annual rate of 157.44%
The company has declared Positive results for the last 4 consecutive quarters
With ROE of 10, it has a Expensive valuation with a 7.5 Price to Book Value
Rising Promoter Confidence
Total Returns (Price + Dividend) 
Latest dividend: 0.3 per share ex-dividend date: Aug-16-2012
Risk Adjusted Returns v/s
Returns Beta

News
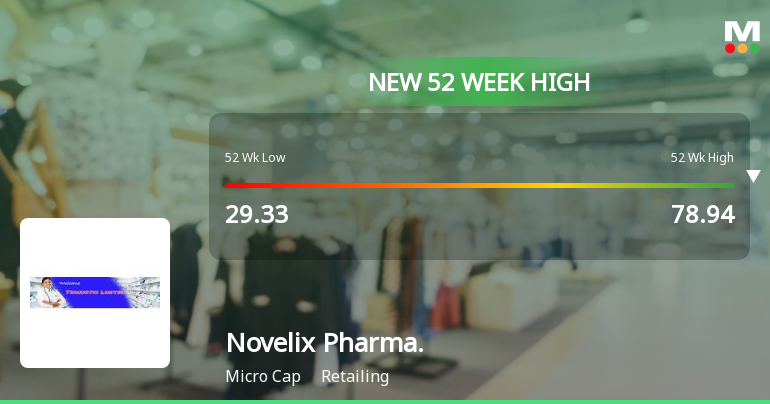
Broad-Based Technical Strength Lifts Novelix Pharmaceuticals Ltd to 52-Week High of Rs 78.94
With a remarkable 48.09% gain over the past five trading sessions, Novelix Pharmaceuticals Ltd surged to a fresh 52-week high of Rs 78.94 on 09 Jun 2026, showcasing robust momentum driven by a confluence of bullish technical indicators.
Read full news article

Broad-Based Technical Strength Lifts Novelix Pharmaceuticals Ltd to 52-Week High of Rs 71
Surging to an intraday peak of Rs 71 on 8 Jun 2026, Novelix Pharmaceuticals Ltd has marked a significant milestone by hitting a fresh 52-week high. This breakout comes amid a sustained four-day rally that has propelled the stock up by 32.9%, underscoring robust price momentum despite a broadly subdued market backdrop.
Read full news article Announcements
Shareholders Meeting- Notice Of Extra-Ordinary General Meeting Under Regulation 30 Of The SEBI (Listing Obligation And Disclosure Requirements) Regulations 2015.
09-Jun-2026 | Source : BSENotice of Extra Ordinary General Meeting
Announcement under Regulation 30 (LODR)-Preferential Issue
05-Jun-2026 | Source : BSESubmission of Intimation of Preferential Issue.
Shareholders Meeting - EGM On 01St July 2026.
05-Jun-2026 | Source : BSESubmission of intimation of EGM Cut-off Date and Remote e-voting period.
Corporate Actions

No Upcoming Board Meetings

Novelix Pharmaceuticals Ltd has declared 3% dividend, ex-date: 16 Aug 12

Novelix Pharmaceuticals Ltd has announced 10:1 stock split, ex-date: 04 Oct 10

No Bonus history available

No Rights history available
Quality key factors
Valuation key factors
Technicals key factors
 Technical Indicator Scale: Bearish, Mildly Bearish, Sideways, Mildly Bullish, Bullish Turned
 Shareholding Snapshot : Jun 2026
Shareholding Compare (%holding)
Promoters
None
Held by 0 Schemes
Held by 0 FIIs
Srinidhi Fine-chemicals Llp (33.07%)
Mallela Venkatramna Reddy (7.66%)
45.8%
Quarterly Results Snapshot (Standalone) - Mar'26 - QoQ

QoQ Growth in quarter ended Mar 2026 is -47.95% vs 33.11% in Dec 2025
QoQ Growth in quarter ended Mar 2026 is -9.00% vs 88.68% in Dec 2025
Half Yearly Results Snapshot (Standalone) - Sep'25

Growth in half year ended Sep 2025 is 1,187.50% vs 58.33% in Sep 2024
Growth in half year ended Sep 2025 is 390.91% vs 8.33% in Sep 2024
Nine Monthly Results Snapshot (Standalone) - Dec'25
YoY Growth in nine months ended Dec 2025 is 986.31% vs 191.72% in Dec 2024
YoY Growth in nine months ended Dec 2025 is 2,442.86% vs 74.07% in Dec 2024
Annual Results Snapshot (Standalone) - Mar'26
YoY Growth in year ended Mar 2026 is 330.70% vs 627.96% in Mar 2025
YoY Growth in year ended Mar 2026 is 3,100.00% vs 700.00% in Mar 2025
About Novelix Pharmaceuticals Ltd

Company Coordinates


