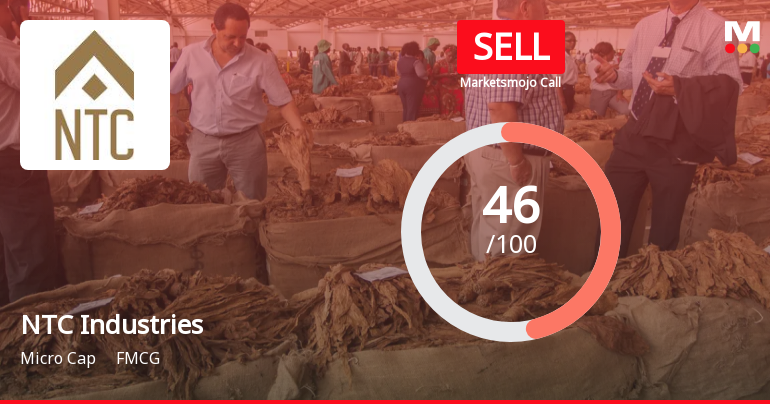
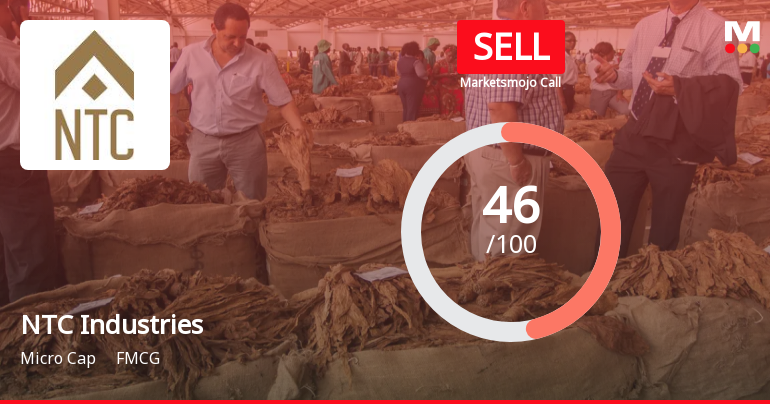
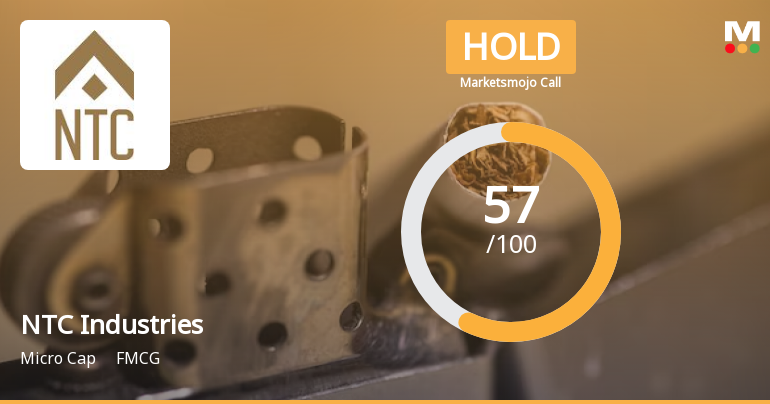
NTC Industries

INR
133.21
-1.59 (-1.18%)
BSENSE

Sep 01, 03:30 PM

BSE+NSE Vol: 9.02 k

  • Price Points
  • Score
  • Mojo Parameters
  • Total Return
  • News and Corporate Actions
  • Key factors
  • Shareholding
  • Financials
  • CompanyCV
stock-summaryPrice Point
High/Low

1Day

52 Week

Valuation
Technical
Day's Volume

CASH

9.02 k (198.51%) Volume

Shareholding (Jun 2026)

FII

5.67%

Held by 4 FIIs

DII

0.00%

Held by 0 DIIs

Promoter

54.34%

Why is NTC Industries Ltd falling/rising?

02-Sep-2026

As of 01-Sep, NTC Industries Ltd's stock price is declining at Rs 132.90, down 1.56%, due to poor performance relative to the market and sector, bearish trading indicators, and financial challenges, including a high Debt to EBITDA ratio. Despite positive sales growth, investor confidence remains low.

As of 01-Sep, NTC Industries Ltd is experiencing a decline in its stock price, currently at Rs 132.90, which reflects a change of -2.1 or -1.56%. This downward movement can be attributed to several factors. <BR><BR>Firstly, the stock has underperformed significantly compared to the broader market, with a year-to-date decline of -18.29% and a one-year drop of -34.79%, while the Sensex has only decreased by -9.71% over the same period. This stark contrast indicates a lack of investor confidence in the stock relative to the market.<BR><BR>Additionally, today's performance shows that the stock has underperformed its sector by -6.47%. The stock reached an intraday high of Rs 138.4 but fell to a low of Rs 130, suggesting volatility and a lack of sustained upward momentum. The weighted average price indicates that more volume was traded closer to the low price, further emphasizing the bearish sentiment.<BR><BR>Moreover, NTC Industries is trading below its moving averages across various time frames, including the 5-day, 20-day, 50-day, 100-day, and 200-day averages, which typically signals a bearish trend. Although there has been an increase in investor participation, with delivery volume rising by 21.23% against the 5-day average, this has not translated into positive price movement.<BR><BR>Financially, while the company has reported positive results over the last seven quarters, including a 28.19% growth in net sales, it also faces challenges such as a high Debt to EBITDA ratio of 3.59 times, indicating a low ability to service its debt. This financial strain contributes to the negative perception among investors.<BR><BR>In summary, the combination of poor stock performance relative to the market, bearish trading indicators, and financial challenges has led to the decline in NTC Industries Ltd's stock price.

View full answer

Who are in the management team of NTC Industries?

01-Sep-2026

The management team of NTC Industries includes Priyawart Dipkabhai Jariwala (Executive Director & Managing Director), Gaurav Somani, Amar Chand Baid, Niraj Sinha (all Independent Non-Executive Directors), Tapan Kumar Chakraborty, and Vembi Krishnamurthy Radha (both Non-Executive Directors).

The management team of NTC Industries includes the following individuals:<BR><BR>1. Priyawart Dipkabhai Jariwala - Executive Director & Managing Director<BR>2. Gaurav Somani - Independent Non-Executive Director<BR>3. Amar Chand Baid - Independent Non-Executive Director<BR>4. Niraj Sinha - Independent Non-Executive Director<BR>5. Tapan Kumar Chakraborty - Non-Executive Director<BR>6. Vembi Krishnamurthy Radha - Non-Executive Director<BR><BR>If you have any more questions about NTC Industries or its management, feel free to ask!

View full answer

What does NTC Industries do?

01-Sep-2026

NTC Industries Ltd is a micro-cap manufacturer of cigarettes and smoking mixtures, originally incorporated in 1931. As of June 2026, it reported net sales of 25 Cr and a net profit of 6 Cr, with a market cap of INR 201 Cr.

Overview:<BR>NTC Industries Ltd is a manufacturer of cigarettes and smoking mixtures, operating in the FMCG industry within the micro-cap market segment.<BR><BR>History:<BR>The company was incorporated in 1931 as National Tobacco Company of India Limited. In 1994, it was acquired by RDB Industries Limited and subsequently rebranded as NTC Industries Limited. The latest quarterly results reported net sales and profit for June 2026.<BR><BR>Financial Snapshot:<BR>- Net Sales: 25 Cr (Quarterly Results - Jun 2026)<BR>- Net Profit: 6 Cr (Quarterly Results - Jun 2026)<BR>- Market-cap: INR 201 Cr (Micro Cap)<BR><BR>Key Metrics:<BR>- P/E: 10.00<BR>- Industry P/E: 17<BR>- Dividend Yield: 0.00%<BR>- Debt-Equity: 0.35<BR>- Return on Equity: 9.32%<BR>- Price to Book: 0.93<BR><BR>Contact Details:<BR>Address: 149 B T Road, Kamarhati Kolkata West Bengal : 700058<BR>Tel: 91-33-7595046813<BR>Email: investors@ntcind.com<BR>Website: http://www.ntcind.com

View full answer

Who are the peers of the NTC Industries?

01-Sep-2026

NTC Industries' peers include Kings Infra, Waterbase, SC Agrotech, Panasonic Energy, Integra Essentia, Dhunseri Tea, Bambino Agro Ind, Goyal Salt, and Goldstar Power. NTC Industries has average management and growth risks, with a 1-year return of -34.39%, better than Kings Infra but worse than SC Agrotech.

Peers: The peers of NTC Industries are Kings Infra, Waterbase, SC Agrotech, Panasonic Energy, Integra Essentia, Dhunseri Tea, Bambino Agro Ind, Goyal Salt, and Goldstar Power.<BR><BR>Quality Snapshot: Excellent management risk is observed at SC Agrotech and Goyal Salt, while Average management risk is found at Kings Infra, Panasonic Energy, Integra Essentia, Dhunseri Tea, Bambino Agro Ind, and NTC Industries, and the rest. Good growth is seen at SC Agrotech and Goyal Salt, while Average growth is noted at NTC Industries, Kings Infra, and the rest. Below Average growth is present at Waterbase, Panasonic Energy, Integra Essentia, Dhunseri Tea, and Bambino Agro Ind. Excellent capital structure is noted at Panasonic Energy and Goldstar Power, while Below Average capital structure is found at NTC Industries, Integra Essentia, Dhunseri Tea, and the rest.<BR><BR>Return Snapshot: SC Agrotech has the highest 1-year return at 81.72%, while Kings Infra has the lowest at -45.70%. NTC Industries' 1-year return is -34.39%, which is better than Kings Infra but worse than SC Agrotech. Additionally, the six-month returns are negative for Kings Infra, Waterbase, SC Agrotech, Panasonic Energy, Integra Essentia, and NTC Industries.

View full answer

How big is NTC Industries?

01-Sep-2026

As of 31st August, NTC Industries Ltd has a market capitalization of 201.00 Cr, with recent Net Sales of 109.76 Cr and a Net Profit of 20.01 Cr.

As of 31st August, NTC Industries Ltd has a market capitalization of 201.00 Cr, categorizing it as a Micro Cap company.<BR><BR>In the latest four quarters, NTC Industries reported Net Sales of 109.76 Cr and a Net Profit of 20.01 Cr.<BR><BR>The latest annual period for the balance sheet is March 2026, showing Shareholder's Funds of 209.90 Cr and Total Assets of 319.99 Cr.

View full answer

Which are the latest news on NTC Industries?

01-Sep-2026

Should I buy, sell or hold NTC Industries Ltd?

16-Aug-2026

Are NTC Industries Ltd latest results good or bad?

27-May-2026

NTC Industries Ltd's latest results show strong revenue growth with a net profit of ₹5.71 crores and a 33.69% increase in net sales year-on-year. However, declining operating and PAT margins indicate rising cost pressures, suggesting investors should remain cautious.

NTC Industries Ltd's latest results present a mixed picture. On one hand, the company achieved a significant net profit of ₹5.71 crores in Q4 FY26, reflecting a robust 49.48% increase quarter-on-quarter and a modest 3.07% growth year-on-year. Additionally, net sales reached ₹31.55 crores, marking an impressive 33.69% year-on-year growth, which indicates strong demand in their market segments.<BR><BR>However, there are notable concerns regarding profitability. The operating margin has decreased to 25.05% from 29.02% year-on-year, and the PAT margin has also contracted significantly from 27.77% to 20.70%. This margin compression suggests rising cost pressures that could impact the company's long-term profitability.<BR><BR>Overall, while NTC Industries has demonstrated strong revenue growth and improved net profit, the declining margins indicate challenges that need to be addressed. Investors should be cautious and monitor how the company manages these margin pressures moving forward.

View full answer

When is the next results date for NTC Industries Ltd?

21-May-2026

The next results date for NTC Industries Ltd is 26 May 2026.

The next results date for NTC Industries Ltd is scheduled for 26 May 2026.

View full answer

How has been the historical performance of NTC Industries?

17-Nov-2025

NTC Industries has shown significant growth in net sales and profitability, with net sales increasing from 21.73 Cr in Mar'19 to 60.09 Cr in Mar'25, and profit after tax rising to 11.37 Cr in Mar'25. The company also experienced a rise in total liabilities and assets, indicating robust financial performance.

Answer:<BR>The historical performance of NTC Industries shows a significant upward trend in net sales and profitability over the years.<BR><BR>Breakdown:<BR>NTC Industries has demonstrated a strong growth trajectory in net sales, increasing from 21.73 Cr in Mar'19 to 60.09 Cr in Mar'25. The total operating income followed a similar pattern, reaching 60.09 Cr in Mar'25, up from 21.73 Cr in Mar'19. The company's operating profit (PBDIT) also improved markedly, rising to 21.80 Cr in Mar'25 from 14.78 Cr in Mar'19, with an operating profit margin of 31.01% in Mar'25. Profit before tax increased to 14.30 Cr in Mar'25, while profit after tax reached 11.37 Cr, reflecting a PAT margin of 24.96%. The company's total liabilities rose to 169.33 Cr in Mar'24, up from 82.08 Cr in Mar'19, with total debt increasing to 46.33 Cr in Mar'24. On the asset side, total assets grew to 169.33 Cr in Mar'24, with current assets at 19.31 Cr. Cash flow from operating activities surged to 90.00 Cr in Mar'24, indicating improved cash generation capabilities. Overall, NTC Industries has shown robust growth in sales and profitability, alongside increasing liabilities and assets over the years.

View full answer

Who are the top shareholders of the NTC Industries?

17-Jul-2025

The top shareholders of NTC Industries include promoter Sheetal Dugar with 13.32%, four Foreign Institutional Investors holding 5.94%, and public shareholder Sukhraj Babulalji Nahar with 4.13%. Individual investors collectively own 30.13% of the shares, with no pledged promoter holdings or mutual fund involvement.

The top shareholders of NTC Industries include the promoters, who hold the majority of the shares. The promoter with the highest holding is Sheetal Dugar, owning 13.32% of the company. Additionally, there are four Foreign Institutional Investors (FIIs) that collectively hold 5.94%. The highest public shareholder is Sukhraj Babulalji Nahar, with a holding of 4.13%. Individual investors also have a significant presence, holding 30.13% of the shares. There are no pledged promoter holdings, and no mutual funds are currently involved with the company.

View full answer

Is NTC Industries overvalued or undervalued?

09-Jun-2025

As of June 3, 2025, NTC Industries is considered very attractive and undervalued with a PE ratio of 25.13, outperforming the Sensex with a 1-year return of 29.83%, despite having a higher PE ratio than some peers like ITC and VST Industries.

As of 3 June 2025, the valuation grade for NTC Industries has moved from attractive to very attractive, indicating a positive shift in its perceived value. The company is currently assessed as undervalued. Key ratios include a PE ratio of 25.13, an EV to EBITDA of 25.53, and a PEG ratio of 1.19, which suggest that the stock is trading at a reasonable valuation compared to its growth prospects.<BR><BR>In comparison to peers, NTC Industries has a higher PE ratio than ITC at 22.42 and VST Industries at 22.98, both of which are considered expensive or fairly valued, respectively. Notably, Indian Wood Products, another very attractive peer, has a significantly higher PE ratio of 52.29. This context reinforces the view that NTC Industries is undervalued relative to its industry peers. Additionally, while the stock has underperformed the Sensex year-to-date, it has shown strong returns over longer periods, with a 1-year return of 29.83% compared to the Sensex's 7.57%.

View full answer

What is the technical trend for NTC Industries?

09-Jun-2025

As of June 5, 2025, NTC Industries is in a sideways trend with mixed signals, showing mildly bullish indicators on the weekly charts and mildly bearish on the monthly charts, indicating a lack of clear direction.

As of 5 June 2025, the technical trend for NTC Industries has changed from mildly bearish to sideways. The current stance is neutral, with mixed signals across different time frames. The weekly MACD is mildly bullish, while the monthly MACD is mildly bearish. The Bollinger Bands indicate bullishness on both weekly and monthly charts. However, daily moving averages are mildly bearish, and the KST shows a similar divergence with a mildly bullish weekly signal and a mildly bearish monthly signal. The Dow Theory also reflects a mildly bullish stance on the weekly chart but is bearish on the monthly. Overall, the indicators suggest a lack of clear direction, reinforcing the sideways trend.

View full answer

Has NTC Industries declared dividend?

06-Jun-2025

NTC Industries Ltd has declared a 5% dividend, amounting to 0.5000 per share, with an ex-date of September 10, 2009. However, the dividend yield is currently 0%, and while there have been significant price returns over various periods, no dividends have contributed to those returns.

NTC Industries Ltd has declared a 5% dividend.<BR><BR>Dividend Details:<BR>- Percentage announced: 5%<BR>- Amount per share: 0.5000<BR>- Ex-date: 10 Sep 09<BR><BR>Dividend Yield: 0%<BR><BR>Total Returns by Period:<BR>In the 6-month period, the price return was -21.35%, the dividend return was 0%, resulting in a total return of -21.35%.<BR><BR>In the 1-year period, the price return was 48.2%, the dividend return was 0%, resulting in a total return of 48.2%.<BR><BR>In the 2-year period, the price return was 180.31%, the dividend return was 0%, resulting in a total return of 180.31%.<BR><BR>In the 3-year period, the price return was 118.94%, the dividend return was 0%, resulting in a total return of 118.94%.<BR><BR>In the 4-year period, the price return was 224.41%, the dividend return was 0%, resulting in a total return of 224.41%.<BR><BR>In the 5-year period, the price return was 649.06%, the dividend return was 0%, resulting in a total return of 649.06%.<BR><BR>Overall, NTC Industries Ltd has declared a dividend, but the dividend yield is currently 0%. The total returns over various periods show significant price appreciation, particularly over the longer term, despite the absence of dividend returns in those periods.

View full answer
iScoreScore
Click here to find our call on this stock
Strong Sell
Sell
Hold
Buy
Strong Buy

Dashboard

1

Low ability to service debt as the company has a high Debt to EBITDA ratio of 3.59 times

  • Low ability to service debt as the company has a high Debt to EBITDA ratio of 3.59 times
  • The company has been able to generate a Return on Equity (avg) of 8.09% signifying low profitability per unit of shareholders funds
stock-summaryMojo Parameters

Mojo Parameters

Loading Valuation Snapshot...

Stock DNA

stock-summary
Industry

FMCG

stock-summary
Market cap

INR Cr (Micro Cap)

stock-summary
P/E

10.00

stock-summary
Industry P/E

NA

stock-summary
Dividend Yield

0.00%

stock-summary
Debt Equity

0.00

stock-summary
Return on Equity

0.00%

stock-summary
Price to Book

0.00

Revenue and Profits:
Net Sales:
25 Cr
(Quarterly Results - Jun 2026)
Net Profit:
6 Cr
stock-summaryTotal Returns
Total Returns (Price + Dividend) stock-summary
Icon
Company does not have enough history
Risk Adjusted Returns v/s stock-summary
Returns Beta
Icon
Beta has not been calculated since enough price history is not available
stock-summaryKey Factors

Quality key factors stock-summary

Factor
Value
Sales Growth (5y)
29.32%
EBIT Growth (5y)
20.33%
EBIT to Interest (avg)
4.24
Debt to EBITDA (avg)
3.15
Net Debt to Equity (avg)
0.35
Sales to Capital Employed (avg)
0.35
Tax Ratio
23.50%
Dividend Payout Ratio
0
Pledged Shares
0
Institutional Holding
5.67%
ROCE (avg)
5.69%
ROE (avg)
8.09%

Valuation key factors

Factor
Value
P/E Ratio
10
Industry P/E
17
Price to Book Value
0.91
EV to EBIT
12.74
EV to EBITDA
11.90
EV to Capital Employed
0.93
EV to Sales
2.41
PEG Ratio
0.33
Dividend Yield
NA
ROCE (Latest)
6.99%
ROE (Latest)
9.32%

Technicals key factors

Indicator
Weekly
Monthly
MACD
Bearish
Bearish
RSI
No Signal
Bearish
Bollinger Bands
Bearish
Bearish
Moving Averages
Bearish (Daily)
KST
Bearish
Bearish
Dow Theory
Mildly Bearish
Mildly Bullish
OBV
No Trend
No Trend
stock-summary Technical Indicator Scale: Bearish, Mildly Bearish, Sideways, Mildly Bullish, Bullish  Turned 
stock-summaryShareholding
Shareholding Snapshot : Jun 2026stock-summary
Shareholding Compare (%holding) stock-summary
Majority shareholders

Promoters

Pledged Promoter Holdings

None

Mutual Funds

Held by 0 Schemes

FIIs

Held by 4 FIIs (5.67%)

Promoter with highest holding

Sheetal Dugar (13.32%)

Highest Public shareholder

Sukhraj Babulalji Nahar (4.13%)

Individual Investors Holdings

28.62%

stock-summaryFinancial
[
  {
    "link": "quarterly",
    "btn_text": "All Quarterly Results",
    "header": "Quarterly Results Snapshot (Consolidated) - Jun'26 - YoY",
    "rhs": [
      {
        "prefix": "Net Sales ",
        "suffix": "YoY Growth in quarter ended Jun 2026 is -10.25% vs 268.41% in Jun 2025",
        "dir": -1
      },
      {
        "prefix": "Consolidated Net Profit ",
        "suffix": "YoY Growth in quarter ended Jun 2026 is 7.94% vs 273.03% in Jun 2025",
        "dir": -1
      }
    ],
    "table": {
      "header": [
        "Jun'26",
        "Jun'25",
        "Change(%)"
      ],
      "body": [
        {
          "field": "Net Sales",
          "val1": "25.23",
          "val2": "28.11",
          "chgp": "-10.25%",
          "chgp_class": "negative"
        },
        {
          "field": "Operating Profit (PBDIT) excl Other Income",
          "val1": "6.60",
          "val2": "5.72",
          "chgp": "15.38%",
          "chgp_class": "positive"
        },
        {
          "field": "Interest",
          "val1": "1.28",
          "val2": "1.76",
          "chgp": "-27.27%",
          "chgp_class": "positive"
        },
        {
          "field": "Exceptional Items",
          "val1": "0.00",
          "val2": "0.00",
          "chgp": "",
          "chgp_class": "neutral"
        },
        {
          "field": "Consolidate Net Profit",
          "val1": "6.12",
          "val2": "5.67",
          "chgp": "7.94%",
          "chgp_class": "positive"
        },
        {
          "field": "Operating Profit Margin (Excl OI)",
          "val1": "31.12%",
          "val2": "23.36%",
          "chgp": "7.76%",
          "chgp_class": "positive"
        }
      ]
    }
  },
  {
    "link": "half-yearly",
    "btn_text": "All Half Yearly Results",
    "header": "Half Yearly Results Snapshot (Consolidated) - Sep'25",
    "rhs": [
      {
        "prefix": "Net Sales ",
        "suffix": " Growth in half year ended Sep 2025 is 135.88% vs 4.02% in Sep 2024",
        "dir": 1
      },
      {
        "prefix": "Consolidated Net Profit ",
        "suffix": " Growth in half year ended Sep 2025 is 188.22% vs -45.71% in Sep 2024",
        "dir": 1
      }
    ],
    "table": {
      "header": [
        "Sep'25",
        "Sep'24",
        "Change(%)"
      ],
      "body": [
        {
          "field": "Net Sales",
          "val1": "54.37",
          "val2": "23.05",
          "chgp": "135.88%",
          "chgp_class": "positive"
        },
        {
          "field": "Operating Profit (PBDIT) excl Other Income",
          "val1": "10.17",
          "val2": "5.09",
          "chgp": "99.80%",
          "chgp_class": "positive"
        },
        {
          "field": "Interest",
          "val1": "3.39",
          "val2": "2.30",
          "chgp": "47.39%",
          "chgp_class": "negative"
        },
        {
          "field": "Exceptional Items",
          "val1": "0.00",
          "val2": "0.00",
          "chgp": "",
          "chgp_class": "neutral"
        },
        {
          "field": "Consolidate Net Profit",
          "val1": "10.03",
          "val2": "3.48",
          "chgp": "188.22%",
          "chgp_class": "positive"
        },
        {
          "field": "Operating Profit Margin (Excl OI)",
          "val1": "21.66%",
          "val2": "32.28%",
          "chgp": "-10.62%",
          "chgp_class": "negative"
        }
      ]
    }
  },
  {
    "link": "nine-monthly",
    "btn_text": "All Nine Monthly Results",
    "header": "Nine Monthly Results Snapshot (Consolidated) - Dec'25",
    "rhs": [
      {
        "prefix": "Net Sales ",
        "suffix": "YoY Growth in nine months ended Dec 2025 is 122.29% vs 23.62% in Dec 2024",
        "dir": 1
      },
      {
        "prefix": "Consolidated Net Profit ",
        "suffix": "YoY Growth in nine months ended Dec 2025 is 137.97% vs -24.12% in Dec 2024",
        "dir": 1
      }
    ],
    "table": {
      "header": [
        "Dec'25",
        "Dec'24",
        "Change(%)"
      ],
      "body": [
        {
          "field": "Net Sales",
          "val1": "81.09",
          "val2": "36.48",
          "chgp": "122.29%",
          "chgp_class": "positive"
        },
        {
          "field": "Operating Profit (PBDIT) excl Other Income",
          "val1": "14.43",
          "val2": "8.33",
          "chgp": "73.23%",
          "chgp_class": "positive"
        },
        {
          "field": "Interest",
          "val1": "5.00",
          "val2": "4.15",
          "chgp": "20.48%",
          "chgp_class": "negative"
        },
        {
          "field": "Exceptional Items",
          "val1": "0.00",
          "val2": "0.00",
          "chgp": "",
          "chgp_class": "neutral"
        },
        {
          "field": "Consolidate Net Profit",
          "val1": "13.85",
          "val2": "5.82",
          "chgp": "137.97%",
          "chgp_class": "positive"
        },
        {
          "field": "Operating Profit Margin (Excl OI)",
          "val1": "17.80%",
          "val2": "22.83%",
          "chgp": "-5.03%",
          "chgp_class": "negative"
        }
      ]
    }
  },
  {
    "link": "annual",
    "btn_text": "All Annual Results",
    "header": "Annual Results Snapshot (Consolidated) - Mar'26",
    "rhs": [
      {
        "prefix": "Net Sales ",
        "suffix": "YoY Growth in year ended Mar 2026 is 87.45% vs 42.63% in Mar 2025",
        "dir": 1
      },
      {
        "prefix": "Consolidated Net Profit ",
        "suffix": "YoY Growth in year ended Mar 2026 is 72.03% vs 124.70% in Mar 2025",
        "dir": -1
      }
    ],
    "table": {
      "header": [
        "Mar'26",
        "Mar'25",
        "Change(%)"
      ],
      "body": [
        {
          "field": "Net Sales",
          "val1": "112.64",
          "val2": "60.09",
          "chgp": "87.45%",
          "chgp_class": "positive"
        },
        {
          "field": "Operating Profit (PBDIT) excl Other Income",
          "val1": "21.35",
          "val2": "14.13",
          "chgp": "51.10%",
          "chgp_class": "positive"
        },
        {
          "field": "Interest",
          "val1": "6.50",
          "val2": "5.94",
          "chgp": "9.43%",
          "chgp_class": "negative"
        },
        {
          "field": "Exceptional Items",
          "val1": "0.00",
          "val2": "0.00",
          "chgp": "",
          "chgp_class": "neutral"
        },
        {
          "field": "Consolidate Net Profit",
          "val1": "19.56",
          "val2": "11.37",
          "chgp": "72.03%",
          "chgp_class": "positive"
        },
        {
          "field": "Operating Profit Margin (Excl OI)",
          "val1": "21.91%",
          "val2": "31.01%",
          "chgp": "-9.10%",
          "chgp_class": "negative"
        }
      ]
    }
  }
]

Quarterly Results Snapshot (Consolidated) - Jun'26 - YoYstock-summary

Jun'26
Jun'25
Change(%)
Net Sales
25.23
28.11
-10.25%
Operating Profit (PBDIT) excl Other Income
6.60
5.72
15.38%
Interest
1.28
1.76
-27.27%
Exceptional Items
0.00
0.00
Consolidate Net Profit
6.12
5.67
7.94%
Operating Profit Margin (Excl OI)
31.12%
23.36%
7.76%
Values in Rs Cr.
Direction Arrows
Net Sales

YoY Growth in quarter ended Jun 2026 is -10.25% vs 268.41% in Jun 2025

Direction Arrows
Consolidated Net Profit

YoY Growth in quarter ended Jun 2026 is 7.94% vs 273.03% in Jun 2025

Half Yearly Results Snapshot (Consolidated) - Sep'25stock-summary

Sep'25
Sep'24
Change(%)
Net Sales
54.37
23.05
135.88%
Operating Profit (PBDIT) excl Other Income
10.17
5.09
99.80%
Interest
3.39
2.30
47.39%
Exceptional Items
0.00
0.00
Consolidate Net Profit
10.03
3.48
188.22%
Operating Profit Margin (Excl OI)
21.66%
32.28%
-10.62%
Values in Rs Cr.
Direction Arrows
Net Sales

Growth in half year ended Sep 2025 is 135.88% vs 4.02% in Sep 2024

Direction Arrows
Consolidated Net Profit

Growth in half year ended Sep 2025 is 188.22% vs -45.71% in Sep 2024

Nine Monthly Results Snapshot (Consolidated) - Dec'25stock-summary

Dec'25
Dec'24
Change(%)
Net Sales
81.09
36.48
122.29%
Operating Profit (PBDIT) excl Other Income
14.43
8.33
73.23%
Interest
5.00
4.15
20.48%
Exceptional Items
0.00
0.00
Consolidate Net Profit
13.85
5.82
137.97%
Operating Profit Margin (Excl OI)
17.80%
22.83%
-5.03%
Values in Rs Cr.
Direction Arrows
Net Sales

YoY Growth in nine months ended Dec 2025 is 122.29% vs 23.62% in Dec 2024

Direction Arrows
Consolidated Net Profit

YoY Growth in nine months ended Dec 2025 is 137.97% vs -24.12% in Dec 2024

Annual Results Snapshot (Consolidated) - Mar'26stock-summary

Mar'26
Mar'25
Change(%)
Net Sales
112.64
60.09
87.45%
Operating Profit (PBDIT) excl Other Income
21.35
14.13
51.10%
Interest
6.50
5.94
9.43%
Exceptional Items
0.00
0.00
Consolidate Net Profit
19.56
11.37
72.03%
Operating Profit Margin (Excl OI)
21.91%
31.01%
-9.10%
Values in Rs Cr.
Direction Arrows
Net Sales

YoY Growth in year ended Mar 2026 is 87.45% vs 42.63% in Mar 2025

Direction Arrows
Consolidated Net Profit

YoY Growth in year ended Mar 2026 is 72.03% vs 124.70% in Mar 2025

stock-summaryCompany CV
About NTC Industries Ltd stock-summary
stock-summary
NTC Industries Ltd
Micro Cap
FMCG
NTC Industries Limited, is one of the oldest manufacturer of cigarettes in India. On September 1931 the company was incorporated as National Tobacco Company of India Limited. In 1994 RDB Industries Limited had purchased the asset and goodwill of the Company and the latter become to be known as NTC industries Limited. Since then, Company engaged in manufacturing of Cigarette and Smoking Mixture and general trading and rendering of services of letting out of properties.
Company Coordinates stock-summary
Company Details
149 B T Road, Kamarhati Kolkata West Bengal : 700058
stock-summary
Tel: 91-33-7595046813
stock-summary
investors@ntcind.com
Registrar Details
Niche Technologies Pvt Ltd , D-511, Bagree Market 5th Floor, 71 B R B B Road , Kolkata