
Compare Nupur Recyclers with Similar Stocks
Dashboard
Flat results in Mar 26
- PAT(Q) At Rs 2.77 cr has Fallen at -18.0% (vs previous 4Q average)
- NON-OPERATING INCOME(Q) is 73.60 % of Profit Before Tax (PBT)
With ROCE of 8.4, it has a Expensive valuation with a 3.4 Enterprise value to Capital Employed
Despite the size of the company, domestic mutual funds hold only 0% of the company
Below par performance in long term as well as near term
Stock DNA
Non - Ferrous Metals
INR 522 Cr (Micro Cap)
36.00
14
0.00%
0.20
10.60%
3.87
Total Returns (Price + Dividend) 
Nupur Recyclers for the last several years.
Risk Adjusted Returns v/s
Returns Beta

News
Nupur Recyclers Ltd is Rated Sell by MarketsMOJO
Nupur Recyclers Ltd is rated 'Sell' by MarketsMOJO, with this rating last updated on 09 June 2025. However, the analysis and financial metrics discussed here reflect the stock's current position as of 09 June 2026, providing investors with an up-to-date view of the company’s performance and outlook.
Read full news article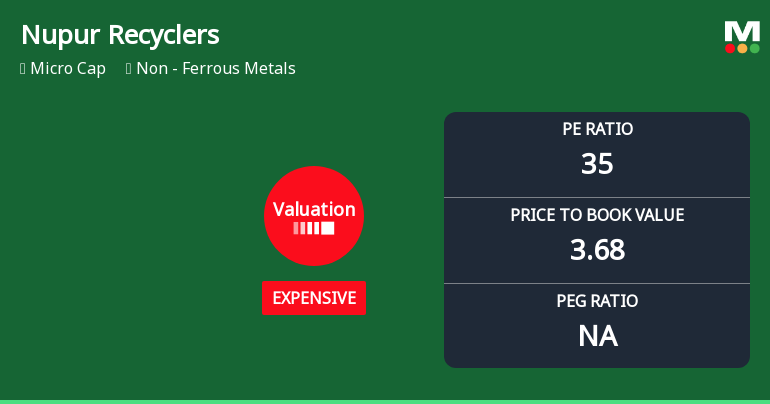
Nupur Recyclers Ltd Valuation Shifts Signal Price Attractiveness Decline
Nupur Recyclers Ltd, a micro-cap player in the non-ferrous metals sector, has seen a marked shift in its valuation parameters, prompting a downgrade in its investment grade from Hold to Sell. With its price-to-earnings (P/E) ratio rising to 34.73 and price-to-book value (P/BV) climbing to 3.68, the stock now trades at a premium compared to its historical averages and peer group, raising questions about its price attractiveness amid mixed operational metrics.
Read full news article
Nupur Recyclers Ltd is Rated Sell
Nupur Recyclers Ltd is rated 'Sell' by MarketsMOJO, with this rating last updated on 09 Jun 2025. However, the analysis and financial metrics discussed here reflect the stock's current position as of 27 May 2026, providing investors with an up-to-date view of the company’s fundamentals, returns, and technical outlook.
Read full news article Announcements
Corporate Actions

No Upcoming Board Meetings

No Dividend history available

No Splits history available

Nupur Recyclers Ltd has announced 1:2 bonus issue, ex-date: 20 Mar 24

No Rights history available
Quality key factors
Valuation key factors
Technicals key factors
 Technical Indicator Scale: Bearish, Mildly Bearish, Sideways, Mildly Bullish, Bullish Turned
 Shareholding Snapshot : Mar 2026
Shareholding Compare (%holding)
Promoters
None
Held by 0 Schemes
Held by 0 FIIs
Rajesh Gupta (36.36%)
Equidem Dealers Private Limited (1.65%)
14.9%
Quarterly Results Snapshot (Consolidated) - Mar'26 - QoQ

QoQ Growth in quarter ended Mar 2026 is -2.65% vs 20.75% in Dec 2025
QoQ Growth in quarter ended Mar 2026 is -31.44% vs 4.39% in Dec 2025
Half Yearly Results Snapshot (Consolidated) - Sep'25

Growth in half year ended Sep 2025 is 14.92% vs -28.74% in Sep 2024
Growth in half year ended Sep 2025 is -19.81% vs 98.71% in Sep 2024
Nine Monthly Results Snapshot (Consolidated) - Dec'25
YoY Growth in nine months ended Dec 2025 is 30.98% vs -38.33% in Dec 2024
YoY Growth in nine months ended Dec 2025 is -7.66% vs 123.42% in Dec 2024
Annual Results Snapshot (Consolidated) - Mar'26
YoY Growth in year ended Mar 2026 is 36.40% vs -34.06% in Mar 2025
YoY Growth in year ended Mar 2026 is -1.59% vs 100.42% in Mar 2025
About Nupur Recyclers Ltd

Company Coordinates


