
Compare Nurture Well Ind with Similar Stocks
Total Returns (Price + Dividend) 
Nurture Well Ind for the last several years.
Risk Adjusted Returns v/s
Returns Beta

News

Nurture Well Industries Ltd is Rated Sell
Nurture Well Industries Ltd is rated Sell by MarketsMOJO, with this rating last updated on 20 May 2026. However, the analysis and financial metrics presented here reflect the stock’s current position as of 11 June 2026, providing investors with the most up-to-date view of the company’s fundamentals, valuation, financial trend, and technical outlook.
Read full news article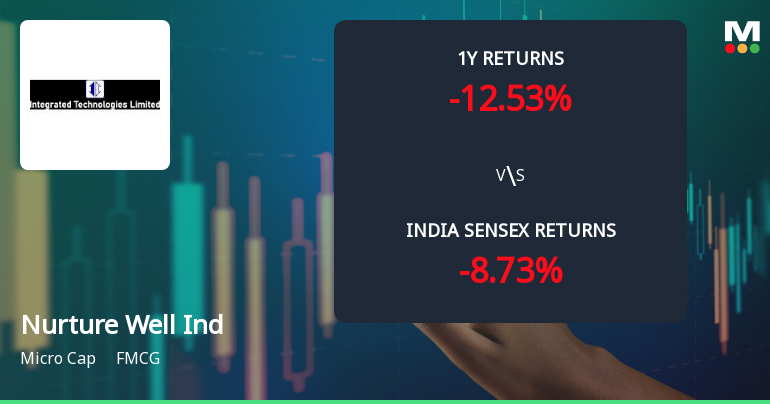
Nurture Well Industries Ltd Faces Technical Downshift Amid Weak Price Momentum
Nurture Well Industries Ltd, a micro-cap player in the FMCG sector, has experienced a notable shift in its technical momentum, signalling a transition from a sideways trend to a mildly bearish outlook. Recent technical indicators, including MACD, RSI, and moving averages, reveal a complex picture of weakening price momentum amid broader market pressures, prompting a downgrade in its Mojo Grade from Hold to Sell as of 19 May 2026.
Read full news article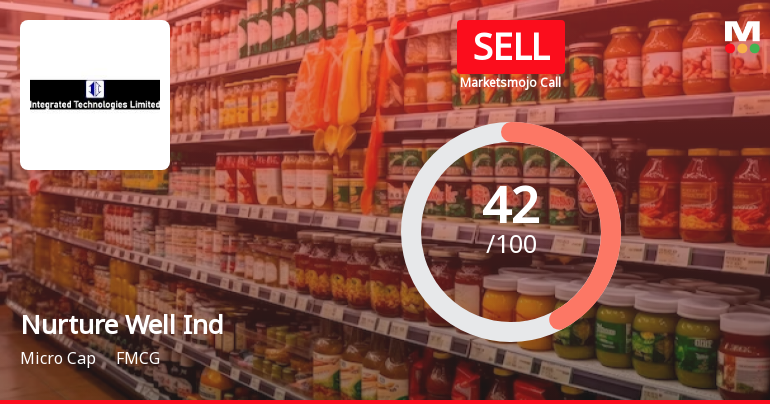
Nurture Well Industries Ltd is Rated Sell
Nurture Well Industries Ltd is rated Sell by MarketsMOJO, with this rating last updated on 20 May 2026. However, the analysis and financial metrics discussed here reflect the stock's current position as of 31 May 2026, providing investors with the most up-to-date view of the company’s fundamentals, returns, and market standing.
Read full news article Announcements
Compliances-Reg.24(A)-Annual Secretarial Compliance
29-May-2026 | Source : BSEAnnual Secretarial Compliance Report for the Financial Year ended 31st March 2026.
Announcement under Regulation 30 (LODR)-Newspaper Publication
20-May-2026 | Source : BSEPlease refers the attached Newspaper Publication.
Audited Financial Results For The Quarter And Financial Year Ended 31St March 2026
19-May-2026 | Source : BSEPlease refers to the attached documents.
Corporate Actions

No Upcoming Board Meetings

No Dividend history available

Nurture Well Industries Ltd has announced 1:10 stock split, ex-date: 01 Oct 24

Nurture Well Industries Ltd has announced 1:1 bonus issue, ex-date: 16 Apr 24

No Rights history available
Quality key factors
Valuation key factors
Technicals key factors
 Technical Indicator Scale: Bearish, Mildly Bearish, Sideways, Mildly Bullish, Bullish Turned
 Shareholding Snapshot : Mar 2026
Shareholding Compare (%holding)
Promoters
None
Held by 4 Schemes (0.06%)
Held by 5 FIIs (0.19%)
Saurabh Goyal (13.7%)
Primus Overseas Private Limited (12.13%)
23.99%
Quarterly Results Snapshot (Consolidated) - Mar'26 - YoY

YoY Growth in quarter ended Mar 2026 is -16.81% vs 72.54% in Mar 2025
YoY Growth in quarter ended Mar 2026 is -105.39% vs 38.85% in Mar 2025
Half Yearly Results Snapshot (Consolidated) - Sep'25
Growth in half year ended Sep 2025 is 64.26% vs 393.49% in Sep 2024
Growth in half year ended Sep 2025 is 75.16% vs 904.05% in Sep 2024
Nine Monthly Results Snapshot (Consolidated) - Dec'25
YoY Growth in nine months ended Dec 2025 is 57.28% vs 173.72% in Dec 2024
YoY Growth in nine months ended Dec 2025 is 78.60% vs 227.02% in Dec 2024
Annual Results Snapshot (Consolidated) - Mar'26
YoY Growth in year ended Mar 2026 is 34.03% vs 131.17% in Mar 2025
YoY Growth in year ended Mar 2026 is 18.80% vs 126.96% in Mar 2025
About Nurture Well Industries Ltd

Company Coordinates


