
Compare Oasis Securities with Similar Stocks
Dashboard
With a Operating Losses, the company has a Weak Long Term Fundamental Strength
- Poor long term growth as Net Sales has grown by an annual rate of -22.72% and Operating profit at -29.36%
Flat results in Mar 26
With ROE of 5.2, it has a Very Expensive valuation with a 3.9 Price to Book Value
Underperformed the market in the last 1 year
Stock DNA
Non Banking Financial Company (NBFC)
INR 55 Cr (Micro Cap)
75.00
21
0.00%
0.00
5.20%
3.90
Total Returns (Price + Dividend) 
Oasis Securities for the last several years.
Risk Adjusted Returns v/s
Returns Beta

News

Oasis Securities Ltd Valuation Shifts to Very Expensive Amid Sharp Price Decline
Oasis Securities Ltd, a micro-cap player in the Non Banking Financial Company (NBFC) sector, has seen a marked deterioration in its valuation attractiveness, with key metrics such as the price-to-earnings (P/E) and price-to-book value (P/BV) ratios escalating to levels categorised as very expensive. This shift comes amid a significant share price decline and underwhelming returns relative to the broader market, raising concerns about the stock’s price risk and investment appeal.
Read full news article
Oasis Securities Ltd is Rated Strong Sell
Oasis Securities Ltd is rated Strong Sell by MarketsMOJO, with this rating last updated on 19 May 2025. However, the analysis and financial metrics discussed here reflect the company’s current position as of 18 June 2026, providing investors with an up-to-date view of its fundamentals, valuation, financial trend, and technical outlook.
Read full news article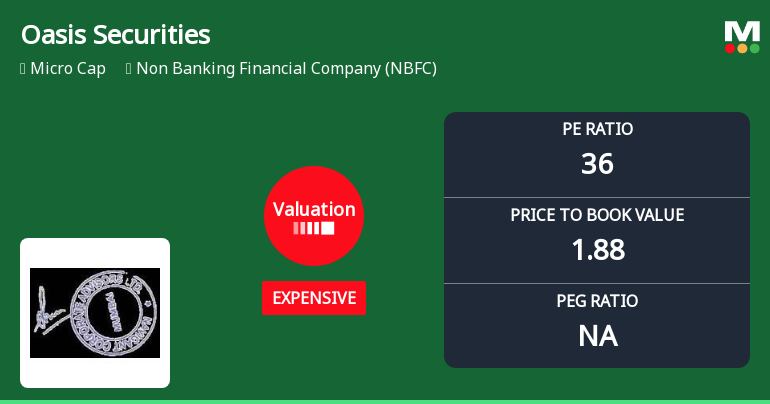
Oasis Securities Ltd Valuation Shifts Signal Price Attractiveness Decline
Oasis Securities Ltd, a micro-cap player in the Non Banking Financial Company (NBFC) sector, has seen a notable shift in its valuation parameters, moving from fair to expensive territory. Despite a recent 5.00% intraday price increase to ₹14.49, the company’s price-to-earnings (P/E) and price-to-book value (P/BV) ratios now raise questions about its price attractiveness relative to historical levels and peer benchmarks.
Read full news article Announcements
Submission Of Letter Of Offer For Rights Issue Of Fully Paid-Up Equity Shares Of Oasis Securities Limited (The Company)
19-Jun-2026 | Source : BSESubmission of Letter of Offer for Rights Issue
Board Meeting Outcome for Outcome Of Board Meeting Held Today I.E. Thursday 18Th June 2026
18-Jun-2026 | Source : BSEPursuant to the Regulation 30 of SEBI (Listing Obligations and Disclosure Requirements) Regulations 2015 we hereby inform you that the Board of Directors in their meeting held today i.e. Thursday 18th June 2026 at the Corporate Office of the Company situated at 2nd Floor C 373 Behind Amar Jain Hospital Block-C Vaishali Nagar Jaipur - 302021 Rajasthan which commenced at 4:00 P.M. and concluded at 5:00 P.M. inter-alia has considered and approved as attached.
Board Meeting Outcome for Outcome Of Board Meeting Held Today I.E. Friday 12Th June 2026
12-Jun-2026 | Source : BSEPursuant to second proviso to Regulation 30(6) of SEBI (Listing Obligations and Disclosure Requirements) Regulations 2015 we hereby inform you that the Board of Directors in their meeting held today i.e. Friday 12th June 2026 at the Corporate Office of the Company situated at 2nd Floor C 373 Behind Amar Jain Hospital Block-C Vaishali Nagar Jaipur - 302021 Rajasthan which commenced at 04:00 P.M. and concluded at 05:00 P.M. inter-alia has considered and approved as attached in Outcome.
Corporate Actions

No Upcoming Board Meetings

No Dividend history available

Oasis Securities Ltd has announced 1:10 stock split, ex-date: 28 Feb 25

No Bonus history available

Oasis Securities Ltd has announced 3:2 rights issue, ex-date: 18 Jun 26
Quality key factors
Valuation key factors
Technicals key factors
 Technical Indicator Scale: Bearish, Mildly Bearish, Sideways, Mildly Bullish, Bullish Turned
 Shareholding Snapshot : Mar 2026
Shareholding Compare (%holding)
Promoters
None
Held by 0 Schemes
Held by 0 FIIs
Rajesh Kumar Sodhani (54.96%)
Oak Transition Management Private Limited (1.51%)
24.41%
Quarterly Results Snapshot (Standalone) - Mar'26 - YoY

YoY Growth in quarter ended Mar 2026 is 58.33% vs -29.41% in Mar 2025

YoY Growth in quarter ended Mar 2026 is -75.76% vs 29.79% in Mar 2025
Half Yearly Results Snapshot (Standalone) - Sep'25
Growth in half year ended Sep 2025 is 20.37% vs -40.66% in Sep 2024
Growth in half year ended Sep 2025 is -25.62% vs -4.72% in Sep 2024
Nine Monthly Results Snapshot (Standalone) - Dec'25
YoY Growth in nine months ended Dec 2025 is 24.83% vs -47.16% in Dec 2024
YoY Growth in nine months ended Dec 2025 is -4.35% vs -26.60% in Dec 2024
Annual Results Snapshot (Standalone) - Mar'26
YoY Growth in year ended Mar 2026 is 32.30% vs -46.15% in Mar 2025
YoY Growth in year ended Mar 2026 is 17.24% vs -38.73% in Mar 2025
About Oasis Securities Ltd

Company Coordinates


