
Compare Objectone Inform with Similar Stocks
Dashboard
Weak Long Term Fundamental Strength with a -27.52% CAGR growth in Operating Profits over the last 5 years
- Company's ability to service its debt is weak with a poor EBIT to Interest (avg) ratio of 0.80
- The company has been able to generate a Return on Equity (avg) of 5.83% signifying low profitability per unit of shareholders funds
Flat results in Mar 26
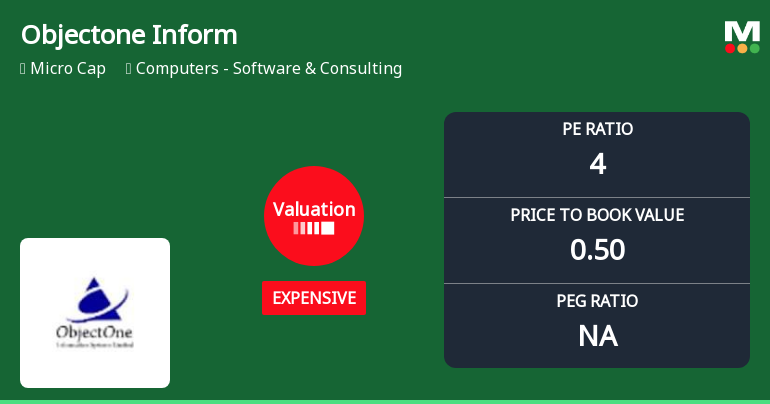
With ROE of 0.6, it has a Expensive valuation with a 0.5 Price to Book Value
Consistent Underperformance against the benchmark over the last 3 years
Stock DNA
Computers - Software & Consulting
INR 7 Cr (Micro Cap)
3.00
20
0.00%
0.03
0.59%
0.47
Total Returns (Price + Dividend) 
Objectone Inform for the last several years.
Risk Adjusted Returns v/s
Returns Beta

News
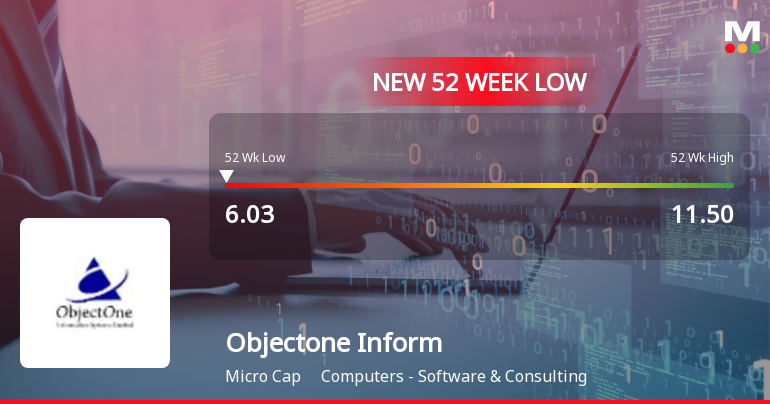
Objectone Information Systems Ltd: Valuation Shifts Signal Price Attractiveness Change
Objectone Information Systems Ltd, a micro-cap player in the Computers - Software & Consulting sector, has experienced a notable shift in its valuation parameters, moving from a 'very expensive' to an 'expensive' rating. This article analyses the recent changes in key valuation metrics such as the price-to-earnings (P/E) and price-to-book value (P/BV) ratios, compares them with peer averages and historical benchmarks, and assesses the implications for investors amid the company’s recent market performance.
Read full news article
Objectone Information Systems Downgraded to Strong Sell Amid Weak Fundamentals and Technical Setbacks
Objectone Information Systems Ltd has been downgraded from a Sell to a Strong Sell rating as of 25 May 2026, reflecting deteriorating technical indicators, weak financial trends, expensive valuation metrics, and poor quality scores. This comprehensive reassessment highlights the challenges facing the micro-cap software and consulting firm amid persistent underperformance and subdued market sentiment.
Read full news article Announcements
Intimation On Receipt Of Request For Re-Lodgement Of Transfer Requests Of Physical Shares As Per SEBI Circular No. SEBI/HO/MIRSD/MIRSD-Pod/P/CIR/2025/97 Dated 2Nd July2025
17-Jul-2026 | Source : BSEPDF ATTACHED
Compliances-Certificate under Reg. 74 (5) of SEBI (DP) Regulations 2018
17-Jul-2026 | Source : BSEPDF ATTACHED
Intimation On Receipt Of Request For Re-Lodgement Of Transfer Requests Of Physical Shares
17-Jul-2026 | Source : BSEPDF ATTACHED
Corporate Actions

No Upcoming Board Meetings

No Dividend history available

No Splits history available

No Bonus history available

No Rights history available
Quality key factors
Valuation key factors
Technicals key factors
 Technical Indicator Scale: Bearish, Mildly Bearish, Sideways, Mildly Bullish, Bullish Turned
 Shareholding Snapshot : Mar 2026
Shareholding Compare (%holding)
Non Institution
None
Held by 0 Schemes
Held by 0 FIIs
Hima Bindu Kantamneni (10.98%)
Swapriyaraj Holdings Llp (8.64%)
68.25%
Quarterly Results Snapshot (Standalone) - Mar'26 - QoQ

QoQ Growth in quarter ended Mar 2026 is 12.14% vs 9.32% in Dec 2025

QoQ Growth in quarter ended Mar 2026 is -8.77% vs 416.67% in Dec 2025
Half Yearly Results Snapshot (Standalone) - Sep'25
Growth in half year ended Sep 2025 is -30.57% vs -18.01% in Sep 2024
Growth in half year ended Sep 2025 is -356.41% vs -81.78% in Sep 2024
Nine Monthly Results Snapshot (Standalone) - Dec'25
YoY Growth in nine months ended Dec 2025 is -21.85% vs -15.14% in Dec 2024
YoY Growth in nine months ended Dec 2025 is -165.15% vs -69.59% in Dec 2024
Annual Results Snapshot (Standalone) - Mar'26
YoY Growth in year ended Mar 2026 is -19.53% vs -11.71% in Mar 2025
YoY Growth in year ended Mar 2026 is -89.29% vs 450.00% in Mar 2025
About Objectone Information Systems Ltd

Company Coordinates


