
Compare Octavius Plant. with Similar Stocks
Dashboard
Weak Long Term Fundamental Strength with a -1.78% CAGR growth in Operating Profits over the last 5 years
- Company's ability to service its debt is weak with a poor EBIT to Interest (avg) ratio of 1.76
- The company has been able to generate a Return on Equity (avg) of 9.74% signifying low profitability per unit of shareholders funds
Total Returns (Price + Dividend) 
Octavius Plant. for the last several years.
Risk Adjusted Returns v/s
Returns Beta

News
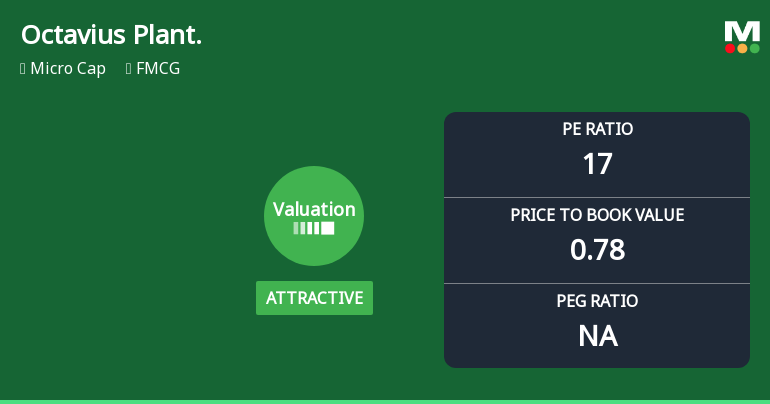
Octavius Plantations Ltd Valuation Shifts Signal Renewed Price Attractiveness
Octavius Plantations Ltd has witnessed a notable transformation in its valuation metrics, shifting from a previously risky profile to one that now appears attractive relative to its historical averages and peer group. This change, coupled with recent price gains and improving market sentiment, invites a closer examination of the company’s price-to-earnings and price-to-book value ratios, alongside other key financial indicators, to assess its current investment appeal within the FMCG sector.
Read full news article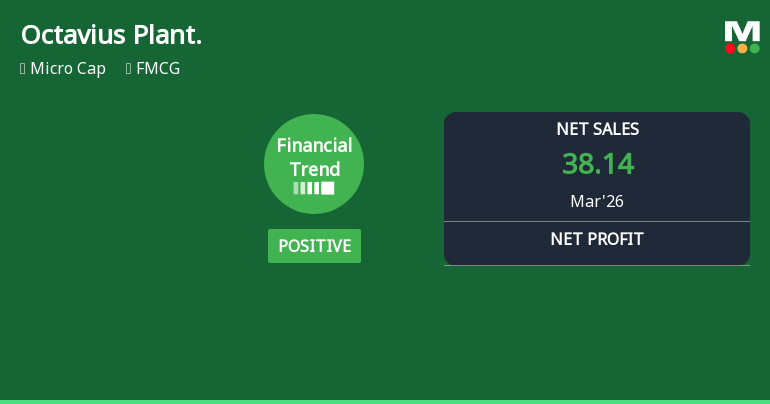
Octavius Plantations Ltd Reports Positive Financial Turnaround in Q4 FY2026
Octavius Plantations Ltd has demonstrated a notable turnaround in its financial trajectory for the quarter ending March 2026, shifting from a previously flat trend to a positive growth phase. Despite ongoing liquidity concerns and micro-cap sector pressures, the company’s recent performance highlights improving sales momentum and a more optimistic outlook within the FMCG sector.
Read full news articleAre Octavius Plantations Ltd latest results good or bad?
Octavius Plantations Ltd's latest financial results for Q4 FY26 reveal a significant contrast between robust revenue growth and declining profitability. The company reported net sales of ₹38.14 crores, reflecting a remarkable year-on-year increase of 714.96%. However, this surge in revenue did not translate into profit, as net profit fell to ₹0.16 crores, a decline of 44.83% from the previous quarter. This resulted in a profit after tax (PAT) margin that contracted sharply to 0.42%, down from 2.00% in Q3 FY26. The operational challenges are further highlighted by a notable increase in the effective tax rate, which surged to 48.39%, consuming a significant portion of pre-tax profits. This high tax burden raises concerns about the company's tax efficiency and potential underlying issues that may need to be addressed. Moreover, the company's operating profit margin, excluding other income, decreased to 1.47%...
Read full news article Announcements
Compliances-Reg.24(A)-Annual Secretarial Compliance
30-May-2026 | Source : BSENon Applicability of Reg 24(A)-Annual Secretarial Compliances
Announcement under Regulation 30 (LODR)-Newspaper Publication
29-May-2026 | Source : BSENewspaper Publication of Audited Financials Results of Financial Year Ended 31.03.2026.
Appointment of Company Secretary and Compliance Officer
28-May-2026 | Source : BSESubmission of Intimation under Regulation 30 of SEBI (Listing Obligation and Disclosure Requirement ) Regulation 2015-Appointment of Company secretary and Compliance Officer with effect from May 27 2026.
Corporate Actions

No Upcoming Board Meetings

No Dividend history available

No Splits history available

No Bonus history available

No Rights history available
Quality key factors
Valuation key factors
Technicals key factors
 Technical Indicator Scale: Bearish, Mildly Bearish, Sideways, Mildly Bullish, Bullish Turned
 Shareholding Snapshot : Mar 2026
Shareholding Compare (%holding)
Non Institution
None
Held by 0 Schemes
Held by 0 FIIs
Shalini Jain (33.8%)
Princi Jain (17.72%)
50.34%
Quarterly Results Snapshot (Standalone) - Mar'26 - QoQ

QoQ Growth in quarter ended Mar 2026 is 163.40% vs 141.33% in Dec 2025

QoQ Growth in quarter ended Mar 2026 is -44.83% vs 190.00% in Dec 2025
Half Yearly Results Snapshot (Standalone) - Sep'25
Growth in half year ended Sep 2025 is -38.41% vs 245.04% in Sep 2024
Growth in half year ended Sep 2025 is 11.43% vs -31.37% in Sep 2024
Nine Monthly Results Snapshot (Standalone) - Dec'25
YoY Growth in nine months ended Dec 2025 is 10.34% vs 79.33% in Dec 2024
YoY Growth in nine months ended Dec 2025 is 6.25% vs -43.86% in Dec 2024
Annual Results Snapshot (Standalone) - Mar'26
YoY Growth in year ended Mar 2026 is 127.03% vs 16.39% in Mar 2025
YoY Growth in year ended Mar 2026 is -3.45% vs -51.12% in Mar 2025
About Octavius Plantations Ltd

Company Coordinates


