
Compare Odigma Consultan with Similar Stocks
Dashboard
Weak Long Term Fundamental Strength with a -218.32% CAGR growth in Operating Profits over the last 5 years
- Company's ability to service its debt is weak with a poor EBIT to Interest (avg) ratio of -1.12
- The company has been able to generate a Return on Equity (avg) of 0.33% signifying low profitability per unit of shareholders funds
Flat results in Mar 26
Risky - Negative EBITDA
Below par performance in long term as well as near term
Stock DNA
Computers - Software & Consulting
INR 71 Cr (Micro Cap)
NA (Loss Making)
32
0.00%
-0.02
-1.67%
1.31
Total Returns (Price + Dividend) 
Odigma Consultan for the last several years.
Risk Adjusted Returns v/s
Returns Beta

News
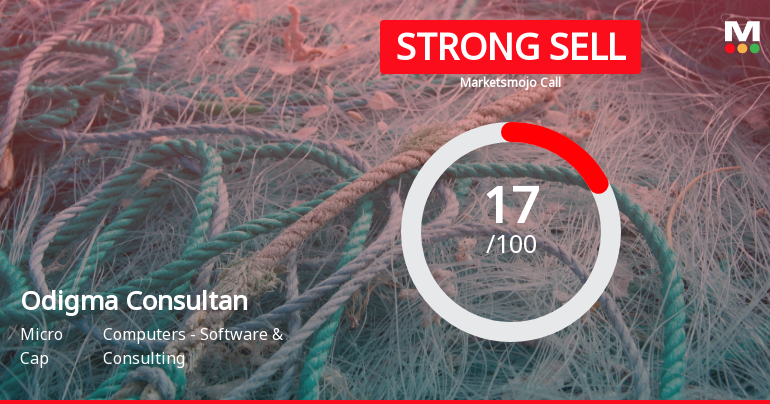
Odigma Consultancy Solutions Ltd is Rated Strong Sell
Odigma Consultancy Solutions Ltd is rated Strong Sell by MarketsMOJO, with this rating last updated on 30 January 2026. However, the analysis and financial metrics discussed here reflect the stock's current position as of 01 August 2026, providing investors with an up-to-date view of the company’s performance and outlook.
Read full news articleWhen is the next results date for Odigma Consultancy Solutions Ltd?
The next results date for Odigma Consultancy Solutions Ltd is scheduled for August 4, 2026....
Read full news article
Odigma Consultancy Solutions Ltd is Rated Strong Sell
Odigma Consultancy Solutions Ltd is rated Strong Sell by MarketsMOJO, with this rating last updated on 30 January 2026. However, the analysis and financial metrics presented here reflect the stock's current position as of 21 July 2026, providing investors with an up-to-date view of the company’s performance and outlook.
Read full news article Announcements
Corporate Actions

04 Aug 2026

No Dividend history available

No Splits history available

No Bonus history available

No Rights history available
Quality key factors
Valuation key factors
Technicals key factors
 Technical Indicator Scale: Bearish, Mildly Bearish, Sideways, Mildly Bullish, Bullish Turned
 Shareholding Snapshot : Jun 2026
Shareholding Compare (%holding)
Non Institution
None
Held by 0 Schemes
Held by 5 FIIs (1.27%)
Vishal Ajitbhai Mehta (8.62%)
Vishwas Ambalal Patel (11.01%)
57.94%
Quarterly Results Snapshot (Standalone) - Mar'26 - QoQ

QoQ Growth in quarter ended Mar 2026 is 43.83% vs -23.95% in Dec 2025
QoQ Growth in quarter ended Mar 2026 is 109.03% vs -1,300.00% in Dec 2025
Half Yearly Results Snapshot (Standalone) - Sep'25

Growth in half year ended Sep 2025 is -12.97% vs 56.11% in Sep 2024
Growth in half year ended Sep 2025 is 43.75% vs 142.11% in Sep 2024
Nine Monthly Results Snapshot (Standalone) - Dec'25
YoY Growth in nine months ended Dec 2025 is -10.76% vs 33.96% in Dec 2024
YoY Growth in nine months ended Dec 2025 is -503.33% vs 15.38% in Dec 2024
Annual Results Snapshot (Standalone) - Mar'26
YoY Growth in year ended Mar 2026 is -10.33% vs 11.81% in Mar 2025
YoY Growth in year ended Mar 2026 is -376.92% vs 680.00% in Mar 2025
About Odigma Consultancy Solutions Ltd

Company Coordinates


