
Compare Ola Electric with Similar Stocks
Dashboard
With a Operating Losses, the company has a Weak Long Term Fundamental Strength
- Poor long term growth as Net Sales has grown by an annual rate of -5.00% and Operating profit at -5.89% over the last 5 years
- Company's ability to service its debt is weak with a poor EBIT to Interest (avg) ratio of -6.56
The company has declared Negative results for the last 7 consecutive quarters
Risky - Negative EBITDA
Stock DNA
Automobiles
INR 18,153 Cr (Small Cap)
NA (Loss Making)
31
0.00%
0.36
-54.70%
5.41
Total Returns (Price + Dividend) 
Ola Electric for the last several years.
Risk Adjusted Returns v/s
Returns Beta

News
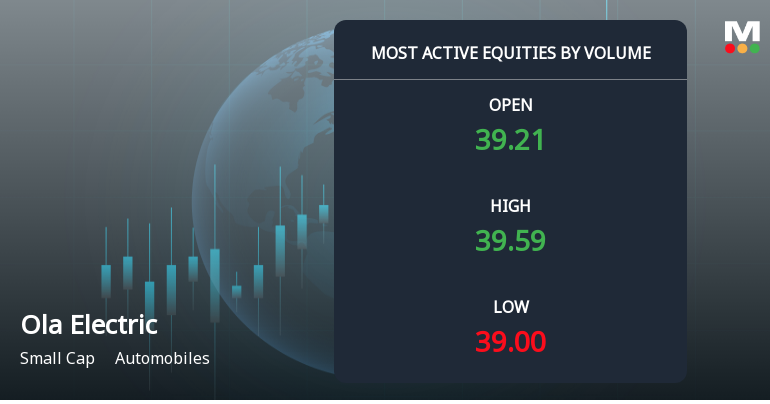
Ola Electric Mobility Ltd Sees Exceptional Volume Amid Mixed Technical Signals
Ola Electric Mobility Ltd (symbol: OLAELEC) emerged as one of the most actively traded stocks on 21 Jul 2026, registering a remarkable volume of 58.59 lakh shares and a traded value exceeding ₹23 crores. Despite a modest price gain of 0.15% outperforming its sector and the Sensex, the stock’s technical indicators and investor participation reveal a nuanced picture for traders and investors alike.
Read full news article
Ola Electric Mobility Ltd Sees Exceptional Volume Amid Mixed Price Action and Strong Sell Rating
Ola Electric Mobility Ltd (symbol: OLAELEC) has emerged as one of the most actively traded stocks by volume on 20 July 2026, registering a total traded volume of 1.32 crore shares and a traded value exceeding ₹52.4 crores. Despite this surge in activity, the stock underperformed its sector and broader market indices, reflecting a complex interplay of investor sentiment and technical factors.
Read full news article
Ola Electric Mobility Ltd Sees Exceptional Volume Amid Mixed Price Signals
Ola Electric Mobility Ltd (symbol: OLAELEC) emerged as one of the most actively traded stocks on 16 July 2026, registering a total traded volume of 65.94 lakh shares and a traded value of ₹26.86 crores. Despite this surge in activity, the stock closed marginally lower at ₹40.54, down 0.49% from the previous close, reflecting a complex interplay of investor sentiment and technical factors in the automobile sector.
Read full news article Announcements
Clarification / Confirmation On News Item Appearing In Media / Publication
08-Jul-2026 | Source : BSEOla Electric Mobility Limited has submitted its response to the clarification sought by the exchange vide its email dated July 7 2026 regarding the news item appeared in the media / publications
Clarification sought from Ola Electric Mobility Ltd
07-Jul-2026 | Source : BSEThe Exchange has sought Clarification from Ola Electric Mobility Ltd with reference to the media report appearing on https://www.ndtvprofit.com dated July 07 2026 (Link: https://www.ndtvprofit.com/markets/ola-electric-shares-slip-5-percent-amid-reports-of-two-suppliers-moving-nclt-over-dues-11732765) titled Ola Electric Shares Slip 5% Amid Reports Of Two Suppliers Moving NCLT Over Dues
The Company is requested to submit its clarification to the Exchange in terms of the provisions of Regulation 30 of the SEBI (LODR) Regulations 2015.
Announcement under Regulation 30 (LODR)-Press Release / Media Release
01-Jul-2026 | Source : BSEOla Electric Mobility Limited has informed the exchange regarding a press release dated July 1 2026
Corporate Actions

No Upcoming Board Meetings

No Dividend history available

No Splits history available

No Bonus history available

No Rights history available
Quality key factors
Valuation key factors
Technicals key factors
 Technical Indicator Scale: Bearish, Mildly Bearish, Sideways, Mildly Bullish, Bullish Turned
 Shareholding Snapshot : Jun 2026
Shareholding Compare (%holding)
Non Institution
None
Held by 19 Schemes (7.51%)
Held by 89 FIIs (5.12%)
Bhavish Aggarwal (26.52%)
Svf Ii Ostrich (de) Llc (12.83%)
28.12%
Quarterly Results Snapshot (Consolidated) - Mar'26 - QoQ

QoQ Growth in quarter ended Mar 2026 is -43.62% vs -31.88% in Dec 2025

QoQ Growth in quarter ended Mar 2026 is -2.67% vs -16.51% in Dec 2025
Half Yearly Results Snapshot (Consolidated) - Sep'25
Growth in half year ended Sep 2025 is -46.89% vs 35.07% in Sep 2024
Growth in half year ended Sep 2025 is -0.48% vs -6.31% in Sep 2024
Nine Monthly Results Snapshot (Consolidated) - Dec'25
YoY Growth in nine months ended Dec 2025 is -49.06% vs 14.39% in Dec 2024
YoY Growth in nine months ended Dec 2025 is 5.19% vs -20.38% in Dec 2024
Annual Results Snapshot (Consolidated) - Mar'26
YoY Growth in year ended Mar 2026 is -50.09% vs -9.90% in Mar 2025
YoY Growth in year ended Mar 2026 is 19.46% vs -43.69% in Mar 2025
About Ola Electric Mobility Ltd

Company Coordinates


