
Compare Ola Electric with Similar Stocks
Dashboard
With a Operating Losses, the company has a Weak Long Term Fundamental Strength
- Poor long term growth as Net Sales has grown by an annual rate of -5.00% and Operating profit at -5.89% over the last 5 years
- Company's ability to service its debt is weak with a poor EBIT to Interest (avg) ratio of -6.56
The company has declared Negative results for the last 7 consecutive quarters
Risky - Negative EBITDA
Stock DNA
Automobiles
INR 19,324 Cr (Small Cap)
NA (Loss Making)
29
0.00%
0.36
-54.70%
5.70
Total Returns (Price + Dividend) 
Ola Electric for the last several years.
Risk Adjusted Returns v/s
Returns Beta

News

Ola Electric Mobility Ltd Sees Robust Trading Activity Amid Strong Market Momentum
Ola Electric Mobility Ltd (symbol: OLAELEC) has emerged as one of the most actively traded stocks by value on 4 June 2026, reflecting heightened investor interest and robust market momentum. The small-cap automobile company recorded a total traded volume of 9.56 crore shares with a turnover exceeding ₹426.5 crores, underscoring significant liquidity and institutional participation in the stock.
Read full news article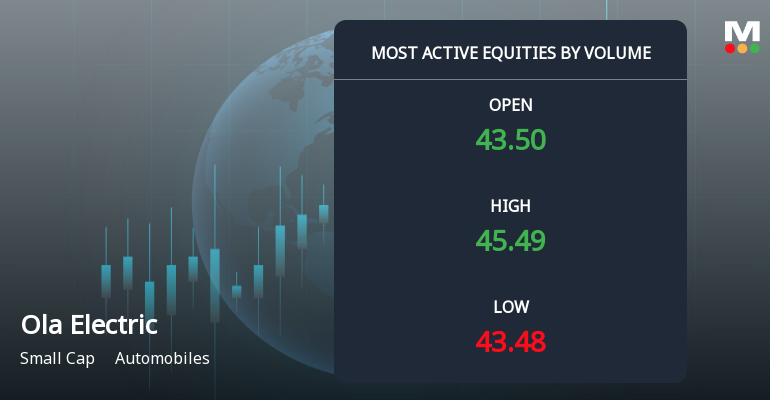
Ola Electric Mobility Ltd Sees Exceptional Volume Surge Amid Strong Buy Signals
Ola Electric Mobility Ltd (symbol: OLAELEC) has emerged as one of the most actively traded stocks by volume on 4 June 2026, registering a remarkable surge in investor participation alongside a steady price appreciation. The stock’s trading volume soared to 9.56 crore shares, reflecting heightened market interest amid a backdrop of sustained gains and positive technical signals.
Read full news article
Ola Electric Mobility Ltd Sees Mixed Technical Signals Amid Price Momentum Shift
Ola Electric Mobility Ltd has experienced a notable shift in price momentum, reflected in a complex interplay of technical indicators that suggest a transition from a mildly bearish trend to a sideways consolidation phase. Despite a robust day change of 9.90%, the stock’s technical landscape presents a nuanced picture for investors navigating the small-cap automobile sector.
Read full news article Announcements
Announcement under Regulation 30 (LODR)-Allotment
04-Jun-2026 | Source : BSEOla Electric Mobility Limited has submitted the outcome of fund raising committee meeting held on today i.e. June 4 2026 for allotment of equity shares
Announcement Under Regulation 30 (LODR)-Qualified Institutional Placement
04-Jun-2026 | Source : BSEOla Electric Mobility Limited has submitted the outcome of fund raising committee meeting held on today i.e. June 4 2026
Announcement Under Regulation 30 (LODR)-Qualified Institutional Placement
01-Jun-2026 | Source : BSEOla Electric Mobility Limited has submitted the outcome of fund raising committee held on today i.e. June 1 2026
Corporate Actions

No Upcoming Board Meetings

No Dividend history available

No Splits history available

No Bonus history available

No Rights history available
Quality key factors
Valuation key factors
Technicals key factors
 Technical Indicator Scale: Bearish, Mildly Bearish, Sideways, Mildly Bullish, Bullish Turned
 Shareholding Snapshot : Mar 2026
Shareholding Compare (%holding)
Non Institution
None
Held by 17 Schemes (5.14%)
Held by 81 FIIs (3.99%)
Bhavish Aggarwal (27.83%)
Svf Ii Ostrich (de) Llc (13.49%)
31.02%
Quarterly Results Snapshot (Consolidated) - Mar'26 - QoQ

QoQ Growth in quarter ended Mar 2026 is -43.62% vs -31.88% in Dec 2025

QoQ Growth in quarter ended Mar 2026 is -2.67% vs -16.51% in Dec 2025
Half Yearly Results Snapshot (Consolidated) - Sep'25
Growth in half year ended Sep 2025 is -46.89% vs 35.07% in Sep 2024
Growth in half year ended Sep 2025 is -0.48% vs -6.31% in Sep 2024
Nine Monthly Results Snapshot (Consolidated) - Dec'25
YoY Growth in nine months ended Dec 2025 is -49.06% vs 14.39% in Dec 2024
YoY Growth in nine months ended Dec 2025 is 5.19% vs -20.38% in Dec 2024
Annual Results Snapshot (Consolidated) - Mar'26
YoY Growth in year ended Mar 2026 is -50.09% vs -9.90% in Mar 2025
YoY Growth in year ended Mar 2026 is 19.46% vs -43.69% in Mar 2025
About Ola Electric Mobility Ltd

Company Coordinates


