
Compare Olympia Financial Group, Inc. with Similar Stocks
Total Returns (Price + Dividend) 
TimePeriod
Price Return
Dividend Return
Total Return
3 Months
14.4%
0%
14.4%
6 Months
12.05%
0%
12.05%
1 Year
12.6%
0%
12.6%
2 Years
50.38%
0%
50.38%
3 Years
84.31%
0%
84.31%
4 Years
121.92%
0%
121.92%
5 Years
189.34%
0%
189.34%
Olympia Financial Group, Inc. for the last several years.
Risk Adjusted Returns v/s
News
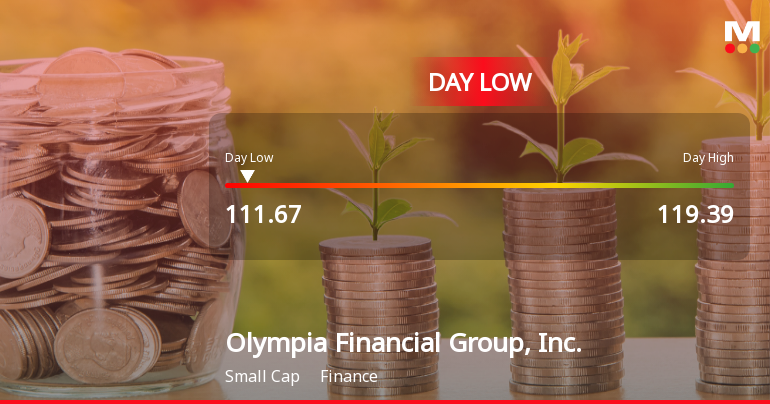
Olympia Financial Group Hits Day Low of CAD 111.67 Amid Price Pressure
Olympia Financial Group, Inc. faced a significant stock price decline today, reaching an intraday low. The company's recent performance contrasts with the S&P/TSX 60, showing a decrease over the past week but a modest gain over the month. Despite challenges, it maintains strong long-term fundamentals and an attractive valuation.
Read full news article Announcements

No announcement available
Corporate Actions
No corporate action available
Quality key factors
Factor
Value
Sales Growth (5y)
16.21%
EBIT Growth (5y)
22.59%
EBIT to Interest (avg)
20.90
Debt to EBITDA (avg)
Negative Net Debt
Net Debt to Equity (avg)
0
Sales to Capital Employed (avg)
0
Tax Ratio
23.00%
Dividend Payout Ratio
72.43%
Pledged Shares
0
Institutional Holding
0
ROCE (avg)
257.67%
ROE (avg)
51.93%
Valuation key factors
Factor
Value
P/E Ratio
11
Industry P/E
Price to Book Value
5.96
EV to EBIT
7.97
EV to EBITDA
7.28
EV to Capital Employed
13.51
EV to Sales
2.29
PEG Ratio
NA
Dividend Yield
NA
ROCE (Latest)
169.57%
ROE (Latest)
52.43%
Technicals key factors
Indicator
Weekly
Monthly
MACD
Mildly Bullish
Mildly Bearish
RSI
No Signal
No Signal
Bollinger Bands
Bearish
Mildly Bullish
Moving Averages
Mildly Bearish (Daily)
KST
Mildly Bullish
Mildly Bearish
Dow Theory
No Trend
No Trend
OBV
No Trend
No Trend
 Technical Indicator Scale: Bearish, Mildly Bearish, Sideways, Mildly Bullish, Bullish Turned
 Shareholding Snapshot
No data for shareholding present.
Shareholding Compare (%holding)
No data for shareholding present.
Quarterly Results Snapshot (Consolidated) - Jun'25 - QoQ
Jun'25
Mar'25
Change(%)
Net Sales
25.60
25.40
0.79%
Operating Profit (PBDIT) excl Other Income
7.90
7.80
1.28%
Interest
0.00
0.00
Exceptional Items
0.00
0.00
Consolidate Net Profit
5.40
5.40
Operating Profit Margin (Excl OI)
280.30%
281.20%
-0.09%
USD in Million.

Net Sales
QoQ Growth in quarter ended Jun 2025 is 0.79% vs -2.31% in Mar 2025
Consolidated Net Profit
QoQ Growth in quarter ended Jun 2025 is 0.00% vs -10.00% in Mar 2025
Annual Results Snapshot (Consolidated) - Dec'24
Dec'24
Dec'23
Change(%)
Net Sales
102.90
100.20
2.69%
Operating Profit (PBDIT) excl Other Income
33.70
34.10
-1.17%
Interest
0.00
0.00
Exceptional Items
0.00
0.00
Consolidate Net Profit
23.90
24.00
-0.42%
Operating Profit Margin (Excl OI)
301.20%
315.20%
-1.40%
USD in Million.

Net Sales
YoY Growth in year ended Dec 2024 is 2.69% vs 38.78% in Dec 2023
Consolidated Net Profit
YoY Growth in year ended Dec 2024 is -0.42% vs 69.01% in Dec 2023
About Olympia Financial Group, Inc.

Olympia Financial Group, Inc.
Finance
Olympia Financial Group Inc. (Olympia) conducts its operations through its subsidiary Olympia Trust Company (Olympia Trust). The Company operates through Registered Plans division, which specializes in account administration and provides administration of registered accounts that invest in arm's length mortgages and syndicated mortgages; Private Health Services Plan division, which markets, sells and administers health and dental benefits to business owners through, Olympia Benefits Inc., a subsidiary of Olympia; Foreign Exchange division, which provides corporations and private clients a personalized service of buying and selling foreign currencies at competitive rates while providing security for the clients throughout the entire process of the transaction, and ATM division, which conducts its business under Olympia ATM Inc. is focused on building a portfolio of automated teller machines (ATMs) and on the retail sale, repair and maintenance of ATMs and ATM parts to other operators.
Company Coordinates
Company Details
2300, 125 - 9 Avenue SE , CALGARY AB : T2G 0P6


Registrar Details
InfinHub Market Technologies FZ-LLC, Building-2, Unit 112, Dubai Internet City, Dubai, United Arab Emirates
GET THE MARKETSMOJO APP


Company
Stocks
Portfolio


"Investment in securities markets are subject to market risk. Read all the related documents carefully before investing."