
Compare Olympic Oil Ind. with Similar Stocks
Dashboard
With a Negative Book Value, the company has a Weak Long Term Fundamental Strength
- Poor long term growth as Net Sales has grown by an annual rate of % and Operating profit at 0% over the last 5 years
- The company has a negative book value of Rs 22.93 crore
Flat results in Mar 26
Risky - Not traded in last 10 days
Stock DNA
Other Agricultural Products
INR 6 Cr (Micro Cap)
NA (Loss Making)
38
0.00%
-4.66
2.01%
-0.27
Total Returns (Price + Dividend) 
Olympic Oil Ind. for the last several years.
Risk Adjusted Returns v/s
Returns Beta

News
Are Olympic Oil Industries Ltd latest results good or bad?
The latest financial results for Olympic Oil Industries Ltd highlight a concerning situation for the company, which has not reported any revenue for six consecutive years, effectively ceasing its trading operations since FY20. In Q4 FY26, the company recorded a net loss of ₹0.06 crores, which is consistent with the loss reported in the same quarter of the previous year, indicating no improvement in its financial performance. The absence of revenue generation is alarming, as the company has reported zero sales for seven consecutive quarters, reflecting a complete halt in its operations. The financial metrics reveal a deteriorating balance sheet, with negative shareholder equity of ₹22.79 crores and a book value per share of -₹79.85. This negative net worth suggests that the company's liabilities exceed its assets, raising serious questions about its viability. The lack of institutional investor interest is ...
Read full news article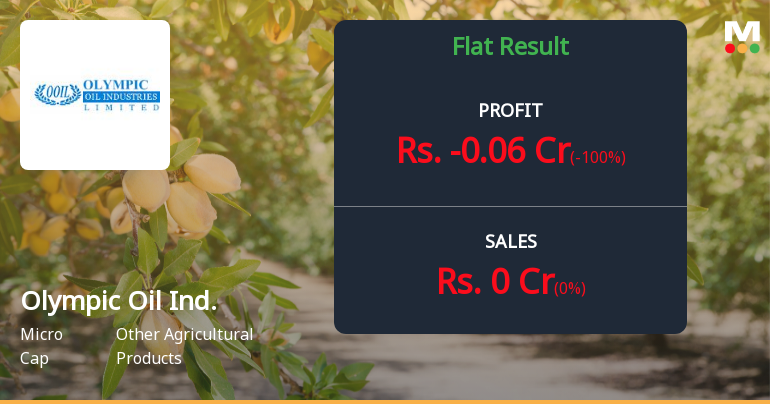
Olympic Oil Industries Q4 FY26: Dormant Operations Continue as Losses Mount
Olympic Oil Industries Ltd., a micro-cap commodity trading company with a market capitalisation of ₹6.00 crores, reported another quarter of zero revenues and mounting losses in Q4 FY26, extending a multi-year pattern of dormant operations. The company posted a net loss of ₹0.06 crores for the March 2026 quarter, with no sales activity recorded for the seventh consecutive quarter. The stock has plunged 52.21% over the past year, trading at ₹21.70 as of May 29, 2026, reflecting deep investor concerns about the company's viability.
Read full news article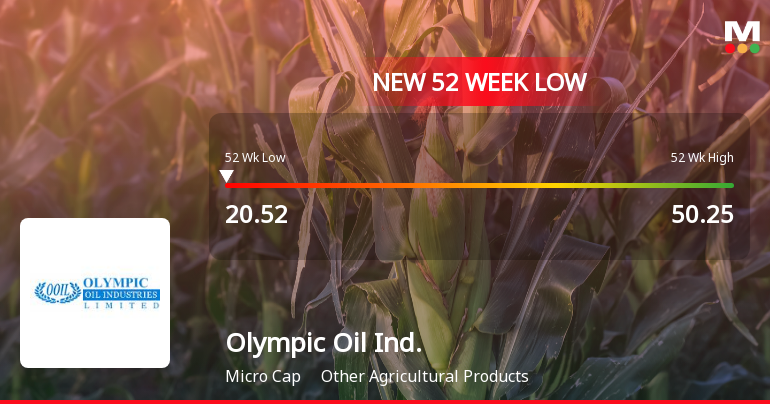
Announcements
Financial Results For Period Ened 31St March 2026
30-May-2026 | Source : BSEAudited FInancial Results along with Statement of Impact of Audit qualifications and Statutory Auditors reports for the quarter and year ended 31st March 2026 enclosed.
Board Meeting Outcome for Outcome Of Board Meeting
30-May-2026 | Source : BSEPlease note that the Board of Directors of the Company at its meeting held on Saturday May 30 2026 (commenced on 05:15 P.M. and concluded at 06:15 P.M.) has considered and approved the Audited Financial Results of the Company for the quarter and financial year ended March 31 2026. Further pursuant to the Regulation 33 of the SEBI (Listing Obligations and Disclosure Requirements) Regulations 2015 please find enclosed Audited Financial Results of the Company for the quarter and financial year ended March 31 2026 alongwith Statement on Impact of Audit Qualifications for the financial Year ended March 31 2026 and Statutory Auditors Report on the financial results for the quarter and year ended March 31 2026.
Board Meeting Intimation for Approval Of Audited Financial Results Of The Company For The Quarter And Year Ended 31St March 2026
23-May-2026 | Source : BSEOlympic Oil Industries Ltdhas informed BSE that the meeting of the Board of Directors of the Company is scheduled on 30/05/2026 inter alia to consider and approve the Audited Financial Results of the Company for the quarter and year ended 31st March 2026. Further as informed earlier vide our letter dated 30th March 2026 the trading window shall continue to remain closed till 48 hours after communication of aforesaid Financial Results to the Stock Exchange.
Corporate Actions

No Upcoming Board Meetings

No Dividend history available

No Splits history available

Olympic Oil Industries Ltd has announced 3:1 bonus issue, ex-date: 19 Nov 12

No Rights history available
Quality key factors
Valuation key factors
Technicals key factors
 Technical Indicator Scale: Bearish, Mildly Bearish, Sideways, Mildly Bullish, Bullish Turned
 Shareholding Snapshot : Mar 2026
Shareholding Compare (%holding)
Non Institution
None
Held by 0 Schemes
Held by 0 FIIs
Sunil Verma (7.64%)
Nextgen Entertainment Private Limited (4.91%)
61.59%
Quarterly Results Snapshot (Standalone) - Mar'26 - QoQ
QoQ Growth in quarter ended Mar 2026 is 0.00% vs 0.00% in Dec 2025

QoQ Growth in quarter ended Mar 2026 is -100.00% vs 50.00% in Dec 2025
Half Yearly Results Snapshot (Standalone) - Sep'25
Growth in half year ended Sep 2025 is 0.00% vs 0.00% in Sep 2024
Growth in half year ended Sep 2025 is 0.00% vs 43.48% in Sep 2024
Nine Monthly Results Snapshot (Standalone) - Dec'25
YoY Growth in nine months ended Dec 2025 is 0.00% vs 0.00% in Dec 2024
YoY Growth in nine months ended Dec 2025 is 11.11% vs 51.35% in Dec 2024
Annual Results Snapshot (Standalone) - Mar'26
YoY Growth in year ended Mar 2026 is 0.00% vs 0.00% in Mar 2025
YoY Growth in year ended Mar 2026 is 12.00% vs 45.65% in Mar 2025
About Olympic Oil Industries Ltd

Company Coordinates


