
Compare Om Infra with Similar Stocks
Total Returns (Price + Dividend) 
Latest dividend: 0.4 per share ex-dividend date: Sep-22-2025
Risk Adjusted Returns v/s
Returns Beta

News

Om Infra Ltd is Rated Sell by MarketsMOJO
Om Infra Ltd is rated 'Sell' by MarketsMOJO, with this rating last updated on 14 May 2026. However, the analysis and financial metrics discussed here reflect the stock's current position as of 04 June 2026, providing investors with the latest insights into the company’s performance and outlook.
Read full news article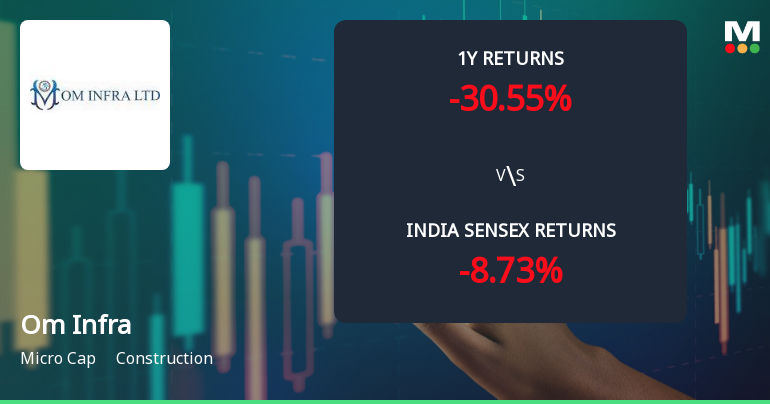
Om Infra Ltd Technical Momentum Shifts Amid Mixed Market Signals
Om Infra Ltd, a micro-cap player in the construction sector, has exhibited a nuanced shift in its technical momentum, moving from a bearish stance to a mildly bearish outlook. Despite a modest day gain of 1.94%, the stock’s technical indicators present a complex picture, with mixed signals from MACD, RSI, moving averages, and other momentum oscillators, reflecting cautious investor sentiment amid broader market volatility.
Read full news article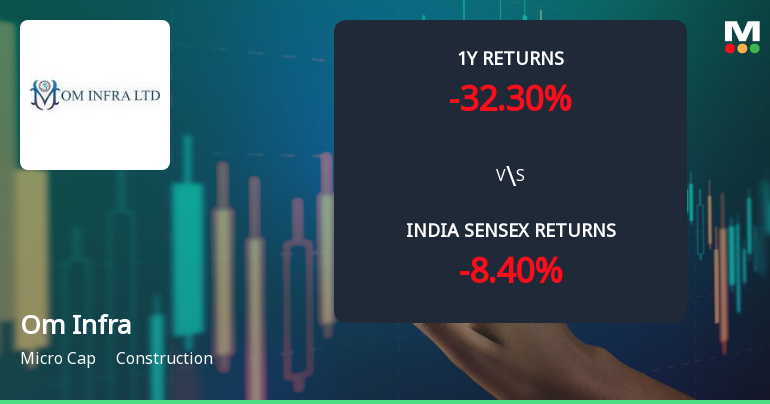
Om Infra Ltd Technical Momentum Shifts Amid Bearish Sentiment
Om Infra Ltd, a micro-cap player in the construction sector, has experienced a notable shift in its technical momentum, with recent indicators signalling a transition from mildly bearish to bearish trends. Despite some mildly bullish weekly signals, the overall technical landscape suggests caution for investors as the stock price declined by 2.48% on 1 June 2026, closing at ₹87.20.
Read full news article Announcements
Compliances-Reg.24(A)-Annual Secretarial Compliance
28-May-2026 | Source : BSEOm Infra Limited hereby submit Annual Secretarial compliance Report for the year ended 31.03.2026
Announcement under Regulation 30 (LODR)-Investor Presentation
20-May-2026 | Source : BSEOm Infra hereby submit presentation to Investors
Announcement under Regulation 30 (LODR)-Resignation of Statutory Auditors
15-May-2026 | Source : BSEOm Infra Limited hereby submit disclosure under Regulation 30 of the SEBI (Listing Obligations and disclosure requirement) Regulation 2015 regarding resignation of Statutory auditor of the Company.
Corporate Actions

No Upcoming Board Meetings

Om Infra Ltd has declared 40% dividend, ex-date: 22 Sep 25

No Splits history available

No Bonus history available

No Rights history available
Quality key factors
Valuation key factors
Technicals key factors
 Technical Indicator Scale: Bearish, Mildly Bearish, Sideways, Mildly Bullish, Bullish Turned
 Shareholding Snapshot : Mar 2026
Shareholding Compare (%holding)
Promoters
None
Held by 1 Schemes (4.06%)
Held by 6 FIIs (0.11%)
T C Kothari And Sons Family Trust (11.85%)
Quant Mutual Fund A/c Quant Infrastructure Fund (4.06%)
22.11%
Quarterly Results Snapshot (Consolidated) - Mar'26 - QoQ

QoQ Growth in quarter ended Mar 2026 is 43.18% vs -9.67% in Dec 2025

QoQ Growth in quarter ended Mar 2026 is -20.05% vs 28.25% in Dec 2025
Half Yearly Results Snapshot (Consolidated) - Sep'25
Growth in half year ended Sep 2025 is -44.07% vs -25.37% in Sep 2024
Growth in half year ended Sep 2025 is -67.74% vs -56.65% in Sep 2024
Nine Monthly Results Snapshot (Consolidated) - Dec'25
YoY Growth in nine months ended Dec 2025 is -37.13% vs -33.91% in Dec 2024
YoY Growth in nine months ended Dec 2025 is -36.54% vs -52.17% in Dec 2024
Annual Results Snapshot (Consolidated) - Mar'26
YoY Growth in year ended Mar 2026 is -29.83% vs -36.02% in Mar 2025
YoY Growth in year ended Mar 2026 is -42.73% vs -23.88% in Mar 2025
About Om Infra Ltd

Company Coordinates


