
Compare Omega Ag Seeds with Similar Stocks
Dashboard
With a Operating Losses, the company has a Weak Long Term Fundamental Strength
- Low ability to service debt as the company has a high Debt to EBITDA ratio of 0.54 times
Flat results in Mar 26
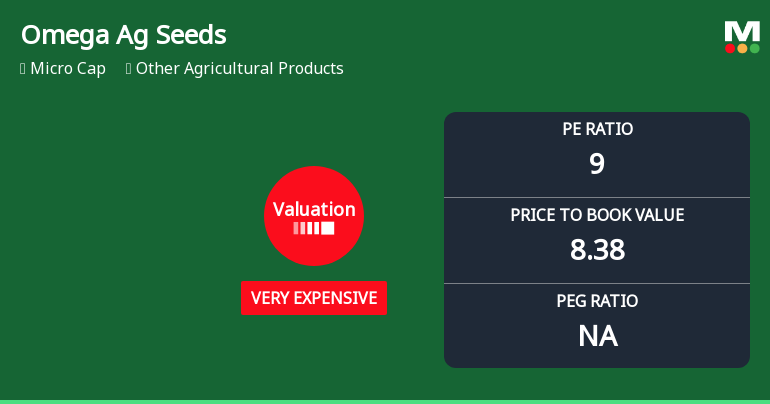
With ROCE of 0, it has a Very Expensive valuation with a 8.2 Enterprise value to Capital Employed
Stock DNA
Other Agricultural Products
INR 7 Cr (Micro Cap)
8.00
21
0.00%
0.53
35.00%
7.27
Total Returns (Price + Dividend) 
Omega Ag Seeds for the last several years.
Risk Adjusted Returns v/s
Returns Beta

News
Omega Ag Seeds Valuation Shifts Signal Changing Market Sentiment
Omega Ag Seeds (Punjab) Ltd has experienced a notable shift in its valuation parameters, moving from a risky valuation grade to one that no longer qualifies under previous risk thresholds. This change, coupled with a recent upgrade in its Mojo Grade to Strong Sell from Sell, highlights evolving market perceptions and price attractiveness in the Other Agricultural Products sector.
Read full news articleAre Omega Ag Seeds (Punjab) Ltd latest results good or bad?
Omega Ag Seeds (Punjab) Ltd has reported its Q4 FY26 financial results, which indicate a significant shift in its operational performance compared to previous quarters. The company recorded net sales of ₹4.06 crores, marking a substantial increase from ₹1.65 crores in Q3 FY26 and a return to revenue generation after several quarters of zero sales. This revenue growth is coupled with a net profit of ₹0.32 crores, a notable turnaround from a loss of ₹0.03 crores in the prior quarter. The profit margin for this quarter stands at 7.88%, an improvement from 4.85% in Q3 FY26. However, despite these quarterly improvements, the broader operational context raises concerns. The company has experienced a highly irregular revenue pattern, with five out of the last seven quarters showing zero sales. This inconsistency raises questions about the sustainability of the recent revenue spike. Additionally, the company repor...
Read full news article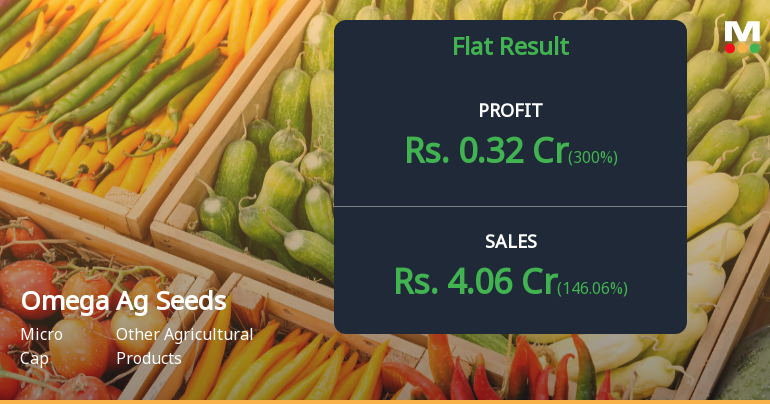
Omega Ag Seeds Q4 FY26: Revenue Revival Masks Structural Concerns
Omega Ag Seeds (Punjab) Ltd., a micro-cap agricultural seed company with a market capitalisation of ₹8.00 crores, reported a net profit of ₹0.32 crores for Q4 FY26, marking a significant turnaround from the losses witnessed in earlier quarters. However, the stock has declined 2.88% in recent trading sessions, reflecting investor scepticism about the sustainability of this recovery amidst a company grappling with negative book value, volatile operations, and minimal institutional confidence.
Read full news article Announcements
Announcement under Regulation 30 (LODR)-Newspaper Publication
15-May-2026 | Source : BSENewspaper Advertisement of the Audited Financial results for the quarter and Year ended March 31 2026.
Audited Financial Results For The Quarter And Year Ended March 31 2026
14-May-2026 | Source : BSEAudited Financial Results for the Quarter and Year ended March 31 2026
Board Meeting Outcome for Audited Financial Results For The Quarter And Year Ended March 31 2026
14-May-2026 | Source : BSEAudited Financial Results for the Quarter and Year Ended March 31 2026
Corporate Actions

No Upcoming Board Meetings

No Dividend history available

No Splits history available

No Bonus history available

No Rights history available
Quality key factors
Valuation key factors
Technicals key factors
 Technical Indicator Scale: Bearish, Mildly Bearish, Sideways, Mildly Bullish, Bullish Turned
 Shareholding Snapshot : Mar 2026
Shareholding Compare (%holding)
Non Institution
None
Held by 0 Schemes
Held by 0 FIIs
Venkatarama Mohanrao Nerella (0.7%)
Keerthi Lakshmi Parvathi Dusanapudi (6.35%)
90.58%
Quarterly Results Snapshot (Standalone) - Mar'26 - QoQ

QoQ Growth in quarter ended Mar 2026 is 146.06% vs 0.00% in Dec 2025

QoQ Growth in quarter ended Mar 2026 is 300.00% vs 500.00% in Dec 2025
Half Yearly Results Snapshot (Standalone) - Sep'25
Growth in half year ended Sep 2025 is 0.00% vs 0.00% in Sep 2024
Growth in half year ended Sep 2025 is 70.59% vs -88.89% in Sep 2024
Nine Monthly Results Snapshot (Standalone) - Dec'25
YoY Growth in nine months ended Dec 2025 is 0.00% vs 0.00% in Dec 2024
YoY Growth in nine months ended Dec 2025 is 112.50% vs -84.62% in Dec 2024
Annual Results Snapshot (Standalone) - Mar'26
YoY Growth in year ended Mar 2026 is 0.00% vs 0.00% in Mar 2025
YoY Growth in year ended Mar 2026 is 0.00% vs 305.88% in Mar 2025
About Omega Ag Seeds (Punjab) Ltd

Company Coordinates


