
Compare Omkar Spl.Chem. with Similar Stocks
Dashboard
With a Negative Book Value, the company has a Weak Long Term Fundamental Strength
- Poor long term growth as Net Sales has grown by an annual rate of -81.20% and Operating profit at 0% over the last 5 years
- The company has a negative book value of Rs 171.05 crore
The company has declared Negative results for the last 4 consecutive quarters
Risky - Not traded in last 10 days
Stock DNA
Specialty Chemicals
INR 7 Cr (Micro Cap)
NA (Loss Making)
18
0.00%
-1.32
7.73%
-0.05
Total Returns (Price + Dividend) 
Latest dividend: 1.5 per share ex-dividend date: Sep-15-2016
Risk Adjusted Returns v/s
Returns Beta

News
When is the next results date for Omkar Speciality Chemicals Ltd?
The next results date for Omkar Speciality Chemicals Ltd is scheduled for June 12, 2026....
Read full news article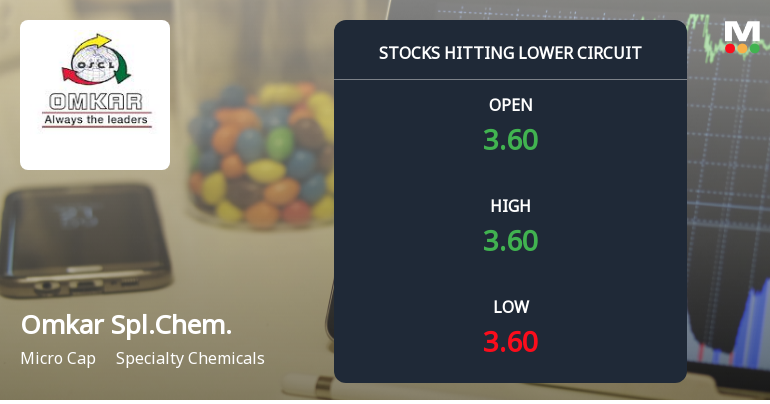
Omkar Speciality Chemicals Ltd Locks at Lower Circuit With 4.75% Loss — Sellers Queue, No Buyers in Sight
At Rs 3.41, sellers were still queuing — but there were no buyers willing to take the other side. Omkar Speciality Chemicals Ltd locked at its lower circuit of 4.75% on 28 Apr 2026, with unfilled sell orders and a frozen price, reflecting persistent selling pressure in a micro-cap stock with limited liquidity.
Read full news article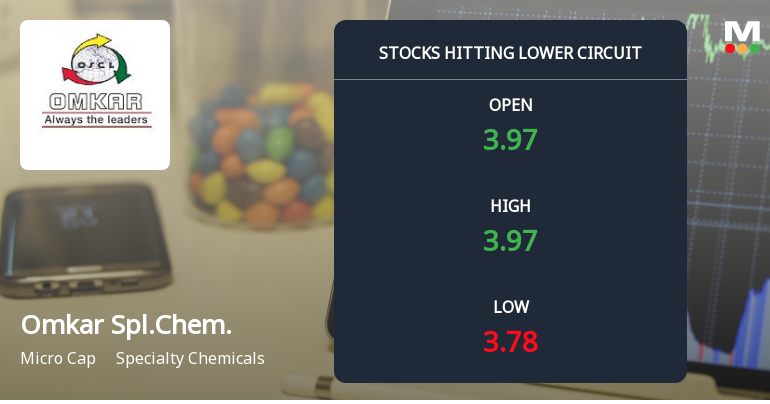
Omkar Speciality Chemicals Ltd Locks at Lower Circuit With 4.79% Loss — Sellers Queue, No Buyers in Sight
At Rs 3.58, sellers were still queuing — but there were no buyers willing to take the other side. Omkar Speciality Chemicals Ltd locked at its lower circuit of 4.79% on 27 Apr 2026, with unfilled sell orders and a frozen price, reflecting persistent selling pressure in a thinly traded micro-cap stock.
Read full news article Announcements
General Update Of Board Meeting Held On June 25 2026 Under Regulation 30 Of The Securities And Exchange Board Of India (Listing Obligations And Disclosure Requirements) Regulations 2015 As Amended
25-Jun-2026 | Source : BSEThe Board of Directors in their meeting held on June 25 2026 has granted approval for sale of properties and has authorized directors to take necessary actions in this regard.
Announcement under Regulation 30 (LODR)-Newspaper Publication
14-Jun-2026 | Source : BSEIntimation of publication of Newspaper Advertisement - Audited Standalone Financial Results for the Quarter & Financial Year ended March 31 2026
Audited Financial Result As On March 31 2026
12-Jun-2026 | Source : BSEAudited Financial Result as on March 31 2026
Corporate Actions

No Upcoming Board Meetings

Omkar Speciality Chemicals Ltd has declared 15% dividend, ex-date: 15 Sep 16

No Splits history available

No Bonus history available

No Rights history available
Quality key factors
Valuation key factors
Technicals key factors
 Technical Indicator Scale: Bearish, Mildly Bearish, Sideways, Mildly Bullish, Bullish Turned
 Shareholding Snapshot : Jun 2022
Shareholding Compare (%holding)
Non Institution
56.729
Held by 0 Schemes
Held by 2 FIIs (0.12%)
Pravin Shivdas Herlekar (10.35%)
None
72.8%
Quarterly Results Snapshot (Standalone) - Mar'26 - YoY
Not Applicable: The company has declared_date for only one period
Not Applicable: The company has declared_date for only one period
Half Yearly Results Snapshot (Standalone) - Sep'25
Not Applicable: The company has declared_date for only one period
Not Applicable: The company has declared_date for only one period
Nine Monthly Results Snapshot (Standalone) - Dec'25
Not Applicable: The company has declared_date for only one period
Not Applicable: The company has declared_date for only one period
Annual Results Snapshot (Standalone) - Mar'26

YoY Growth in year ended Mar 2026 is 0.00% vs -100.00% in Mar 2025

YoY Growth in year ended Mar 2026 is -22.31% vs 89.69% in Mar 2025
About Omkar Speciality Chemicals Ltd

Company Coordinates


