
Compare Omnicom Group, Inc. with Similar Stocks
Dashboard
1
High Management Efficiency with a high ROCE of 38.22%
2
Strong ability to service debt as the company has a low Debt to EBITDA ratio of 1.02 times
3
Poor long term growth as Net Sales has grown by an annual rate of 2.63% over the last 5 years
4
Flat results in Jun 25
5
With ROCE of 32.55%, it has a fair valuation with a 3.20 Enterprise value to Capital Employed
6
Consistent Underperformance against the benchmark over the last 3 years
Total Returns (Price + Dividend) 
TimePeriod
Price Return
Dividend Return
Total Return
3 Months
-19.14%
0%
-19.14%
6 Months
-25.22%
0%
-25.22%
1 Year
-23.14%
0%
-23.14%
2 Years
-26.83%
0%
-26.83%
3 Years
1.69%
0%
1.69%
4 Years
-16.65%
0%
-16.65%
5 Years
18.96%
0%
18.96%
Omnicom Group, Inc. for the last several years.
Risk Adjusted Returns v/s
News
Omnicom Group, Inc. Experiences Revision in Its Stock Evaluation Amid Mixed Market Metrics
Omnicom Group, Inc. has recently adjusted its valuation, showcasing a P/E ratio of 13 and a price-to-book value of 4.58. The company maintains a strong dividend yield of 97.32% and impressive returns on capital and equity. Its performance over the past year has been mixed, contrasting with a five-year resilience.
Read full news article Announcements

No announcement available
Corporate Actions
No corporate action available
Quality key factors
Factor
Value
Sales Growth (5y)
2.63%
EBIT Growth (5y)
3.94%
EBIT to Interest (avg)
9.73
Debt to EBITDA (avg)
1.02
Net Debt to Equity (avg)
0.67
Sales to Capital Employed (avg)
1.52
Tax Ratio
27.70%
Dividend Payout Ratio
37.56%
Pledged Shares
0
Institutional Holding
100.00%
ROCE (avg)
38.22%
ROE (avg)
44.33%
Valuation key factors
Factor
Value
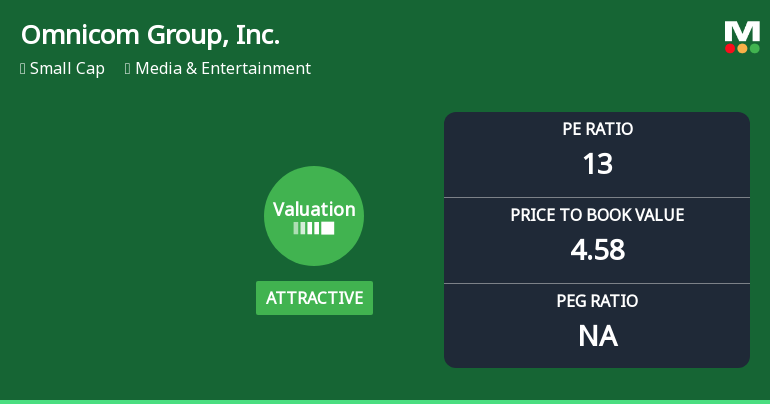
P/E Ratio
13
Industry P/E
Price to Book Value
4.58
EV to EBIT
9.82
EV to EBITDA
8.90
EV to Capital Employed
3.20
EV to Sales
1.45
PEG Ratio
NA
Dividend Yield
97.32%
ROCE (Latest)
32.55%
ROE (Latest)
36.44%
Technicals key factors
Indicator
Weekly
Monthly
MACD
Bearish
Bearish
RSI
No Signal
No Signal
Bollinger Bands
Bearish
Bearish
Moving Averages
Mildly Bullish (Daily)
KST
Bullish
Bearish
Dow Theory
Mildly Bearish
Mildly Bearish
OBV
Mildly Bearish
Mildly Bullish
 Technical Indicator Scale: Bearish, Mildly Bearish, Sideways, Mildly Bullish, Bullish Turned
 Shareholding Snapshot : Sep 2025
Shareholding Compare (%holding)
Majority shareholders
Domestic Funds
Domestic Funds
Held in 145 Schemes (50.96%)
Foreign Institutions
Held by 373 Foreign Institutions (22.25%)
Strategic Entities with highest holding
Highest Public shareholder
Quarterly Results Snapshot (Consolidated) - Sep'25 - YoY
Sep'25
Sep'24
Change(%)
Net Sales
4,037.10
3,882.60
3.98%
Operating Profit (PBDIT) excl Other Income
629.40
661.50
-4.85%
Interest
60.40
66.40
-9.04%
Exceptional Items
-38.60
0.00
Consolidate Net Profit
360.40
409.90
-12.08%
Operating Profit Margin (Excl OI)
140.90%
154.60%
-1.37%
USD in Million.

Net Sales
YoY Growth in quarter ended Sep 2025 is 3.98% vs 8.51% in Sep 2024
Consolidated Net Profit
YoY Growth in quarter ended Sep 2025 is -12.08% vs 5.56% in Sep 2024
Annual Results Snapshot (Consolidated) - Dec'24
Dec'24
Dec'23
Change(%)
Net Sales
15,689.10
14,692.20
6.79%
Operating Profit (PBDIT) excl Other Income
2,588.70
2,315.80
11.78%
Interest
247.90
218.50
13.46%
Exceptional Items
-72.40
0.00
Consolidate Net Profit
1,574.00
1,473.20
6.84%
Operating Profit Margin (Excl OI)
149.60%
143.30%
0.63%
USD in Million.

Net Sales
YoY Growth in year ended Dec 2024 is 6.79% vs 2.82% in Dec 2023
Consolidated Net Profit
YoY Growth in year ended Dec 2024 is 6.84% vs 4.94% in Dec 2023
About Omnicom Group, Inc.

Omnicom Group, Inc.
Media & Entertainment
Omnicom Group Inc. is a holding company. The Company provides advertising, marketing and corporate communications services. The Company's branded networks and agencies operate in all markets around the world and provide a range of services, which it groups into four disciplines: advertising, customer relationship management (CRM), public relations and specialty communications. The Company caters to various industry sectors, such as food and beverage, consumer products, pharmaceuticals and healthcare, financial services, technology, travel and entertainment, telecommunications and retail. The Company's branded networks and agencies conduct business on a global basis and operate in the geographic regions, such as The Americas, which includes North America and Latin America; EMEA, which includes Europe, the Middle East and Africa, and Asia Pacific, which includes Australia, China, India, Japan, Korea, New Zealand, Singapore and other Asian countries.
Company Coordinates
Company Details
280 Park Avenue , NEW YORK NY : 10022


Registrar Details
InfinHub Market Technologies FZ-LLC, Building-2, Unit 112, Dubai Internet City, Dubai, United Arab Emirates
GET THE MARKETSMOJO APP


Company
Stocks
Portfolio


"Investment in securities markets are subject to market risk. Read all the related documents carefully before investing."