Omnitex Industri

  • Market Cap: Micro Cap
  • Industry: Garments & Apparels
  • ISIN: INE814D01010
  • NSEID:
  • BSEID: 514324
INR
553.55
0.00 (0.00%)
BSENSE

Dec 04

BSE+NSE Vol: 1.28 k

  • Price Points
  • Score
  • Mojo Parameters
  • Total Return
  • News and Corporate Actions
  • Key factors
  • Shareholding
  • Financials
  • CompanyCV
stock-summaryPrice Point
High/Low

1Day

52 Week

Valuation
Technical
Day's Volume

CASH

1.28 k (17.21%) Volume

Shareholding (Sep 2025)

FII

2.12%

Held by 1 FIIs

DII

0.00%

Held by 0 DIIs

Promoter

43.08%

Who are the top shareholders of the Omnitex Industri?

06-Jun-2025

The top shareholder of Omnitex Industri is Ashok Metharam Bhawnani, holding 22.01%. Other notable shareholders include Piramal Nextgen Industries Private Limited at 3.11% and individual investors with a combined 22.04%, while there are no reported holdings from mutual funds or foreign institutional investors.

The top shareholders of Omnitex Industri include Ashok Metharam Bhawnani, who holds the largest stake at 22.01%. The company is primarily controlled by its promoters, with no pledged promoter holdings reported. The highest public shareholder is Piramal Nextgen Industries Private Limited, which holds 3.11%. Additionally, individual investors collectively own 22.04% of the company. There are currently no holdings reported from mutual funds or foreign institutional investors.

Read More

Who are in the management team of Omnitex Industri?

06-Jun-2025

As of March 2022, the management team of Omnitex Industri includes Amit R Dalmia (Chairman), J Ramakrishnan, Durgaprasad S Sabnis, Narendra Kumar Dalmia (Managing Director), Ashok M Bhawnani, Meghna Mahendra Savla (Independent Director), and Chaitanya C. Kulkarni (Company Secretary), with all members receiving a remuneration of Rs. 0.

As of March 2022, the management team of Omnitex Industri includes the following members:<BR><BR>1. Amit R Dalmia - Chairman & Independent Director<BR>2. J Ramakrishnan - Director<BR>3. Durgaprasad S Sabnis - Director<BR>4. Narendra Kumar Dalmia - Managing Director<BR>5. Ashok M Bhawnani - Director<BR>6. Meghna Mahendra Savla - Independent Director<BR>7. Chaitanya C. Kulkarni - Company Secretary & Compliance Officer<BR><BR>Each member is noted to have a remuneration of Rs. 0.

Read More

What does Omnitex Industri do?

06-Jun-2025

Omnitex Industries (India) Ltd, established in 1987, trades fabrics and yarn in the Garments & Apparels industry and currently has a market cap of Rs 134 Cr, reporting no sales and a net profit of -1 Cr as of March 2025. Key metrics include a P/E of 106.00 and a dividend yield of 2.51%.

Overview:<BR>Omnitex Industries (India) Ltd is engaged in trading of fabrics and yarn within the Garments & Apparels industry and is categorized as a Micro Cap company.<BR><BR>History:<BR>Incorporated in 1987, Omnitex Industries has undergone significant changes, including a successful joint venture in technical textiles and infrastructure development. As of the latest quarterly results for March 2025, the company reported no sales and a net profit of -1 Cr.<BR><BR>Financial Snapshot:<BR>Most recent Net Sales: 0 Cr (Quarterly Results - Mar 2025) <BR>Most recent Net Profit: -1 Cr (Quarterly Results - Mar 2025) <BR>Market-cap value: Rs 134 Cr (Micro Cap)<BR><BR>Key Metrics:<BR>P/E: 106.00 <BR>Industry P/E: 23 <BR>Dividend Yield: 2.51% <BR>Debt-Equity: -0.57 <BR>Return on Equity: 0.72% <BR>Price to Book: 0.76 <BR><BR>Contact Details:<BR>Address: Sabnam House Plot No A 15/16, Central Cr Rd-B MIDC Andheri-E Mumbai Maharashtra : 400093 <BR>Email: info@omitex.com <BR>Website: http://www.omnitex.com

Read More

Has Omnitex Industri declared dividend?

06-Jun-2025

Omnitex Industries (India) Ltd has declared an 80% dividend, amounting to ₹8 per share, with an ex-date of August 20, 2024. The company has demonstrated strong total returns, including a 591.36% return over 2 years and 1832.35% over 5 years.

Omnitex Industries (India) Ltd has declared an 80% dividend.<BR><BR>Dividend Details:<BR>- Percentage announced: 80%<BR>- Amount per share: 8<BR>- Ex-date: 20 Aug 24<BR><BR>Dividend Yield: 2.51%.<BR><BR>Total Returns by Period:<BR>In the 6-month period, the price return was 22.8%, with a dividend return of 0%, resulting in a total return of 22.8%.<BR><BR>For the 1-year period, the price return was 98.57%, the dividend return was 4.76%, leading to a total return of 103.33%.<BR><BR>Over 2 years, the price return was 575.31%, with a dividend return of 16.05%, culminating in a total return of 591.36%.<BR><BR>In the 3-year period, there was no price return or dividend return, resulting in a total return of 0.0%.<BR><BR>For the 4-year period, the price return was 1132.69%, the dividend return was 35.79%, achieving a total return of 1168.48%.<BR><BR>In the 5-year period, the price return was 1785.29%, with a dividend return of 47.06%, resulting in a total return of 1832.35%.<BR><BR>Overall, Omnitex Industries has declared a significant dividend while also showing strong total returns across multiple periods, indicating a positive financial performance and shareholder value enhancement.

Read More

Who are the peers of the Omnitex Industri?

03-Jun-2025

Omnitex Industri's peers include Trent, Page Industries, K P R Mill Ltd, Vedant Fashions, Trident, Suryalak. Cott., SEL Mfg. Co, Osiajee Texfab, Amarjothi Spg., and Bhilwara Spinner, with varying management risk, growth, and capital structure ratings. Notably, Osiajee Texfab has the highest 1-year return at 428.40%, while SEL Mfg. Co has the lowest at -44.95%.

Peers: The peers of Omnitex Industri are Trent, Page Industries, K P R Mill Ltd, Vedant Fashions, Trident, Suryalak. Cott., SEL Mfg. Co, Osiajee Texfab, Amarjothi Spg., and Bhilwara Spinner.<BR><BR>Quality Snapshot: Excellent management risk is observed at Page Industries, K P R Mill Ltd, and Vedant Fashions, while Good management risk is found at Trent and Osiajee Texfab. Average management risk is present at Omnitex Industri and Trident, while Below Average management risk is noted at Suryalak. Cott., SEL Mfg. Co, Amarjothi Spg., and Bhilwara Spinner. In terms of Growth, Excellent growth is seen at K P R Mill Ltd and Osiajee Texfab, while Good growth is noted at Trent, Suryalak. Cott., and Amarjothi Spg. Average growth is present at Omnitex Industri and Trident, while Below Average growth is found at Page Industries, Vedant Fashions, and SEL Mfg. Co. Capital Structure ratings show Excellent at Page Industries, K P R Mill Ltd, and Vedant Fashions, while Good is noted at Trident and Osiajee Texfab. Below Average capital structure is observed at Omnitex Industri, Suryalak. Cott., SEL Mfg. Co, Amarjothi Spg., and Bhilwara Spinner.<BR><BR>Return Snapshot: Osiajee Texfab has the highest 1-year return at 428.40%, while SEL Mfg. Co has the lowest at -44.95%. Omnitex Industri's own 1-year return of 100.30% is significantly higher than SEL Mfg. Co's. Additionally, the peers with negative six-month returns include Vedant Fashions, Trident, SEL Mfg. Co, and Bhilwara Spinner.

Read More

Is Omnitex Industri overvalued or undervalued?

09-Jun-2025

As of December 12, 2023, Omnitex Industri is considered a risky investment due to its high PE ratio of 105.99, negative operational efficiency indicated by an EV to EBITDA ratio of -33.97, and poor financial health metrics, despite a 90.53% return over the past year, which raises caution for potential investors.

As of 12 December 2023, Omnitex Industri's valuation grade has moved from does not qualify to risky, indicating a significant shift in its perceived investment quality. The company is currently assessed as overvalued, primarily due to its high PE ratio of 105.99, which starkly contrasts with peers like K P R Mill Ltd at 47.51 and Trident at 42.6. Additionally, Omnitex's EV to EBITDA ratio stands at -33.97, suggesting substantial operational inefficiencies compared to the industry.<BR><BR>In terms of financial health, Omnitex's Price to Book Value is 0.77, which may imply some undervaluation in asset terms, but this is overshadowed by its negative ROCE of -0.19% and a low ROE of 0.72%. The company's dividend yield of 2.50% offers some return, but it does not compensate for the overall risk presented by its valuation metrics. Notably, while Omnitex has outperformed the Sensex over the past year with a return of 90.53% compared to the Sensex's 7.59%, the underlying financial ratios suggest caution for potential investors.

Read More

What is the technical trend for Omnitex Industri?

09-Jun-2025

As of May 28, 2025, Omnitex Industri's technical trend is bullish, supported by positive moving averages and Bollinger Bands, despite a mildly bearish weekly MACD and no momentum signals from the RSI.

As of 28 May 2025, the technical trend for Omnitex Industri has changed from mildly bullish to bullish. The weekly MACD is currently mildly bearish, while the monthly MACD indicates a bullish stance. Both the weekly and monthly Bollinger Bands are bullish, supporting the overall positive outlook. Daily moving averages are also bullish, reinforcing the strength of the trend. Dow Theory confirms a bullish trend on both weekly and monthly time frames. The RSI shows no signals on both time frames, indicating a lack of momentum indicators. Overall, the current technical stance is bullish with moderate strength, driven primarily by the moving averages and Bollinger Bands.

Read More

How big is Omnitex Industri?

24-Jul-2025

As of 24th July, Omnitex Industries (India) Ltd has a market capitalization of 229.00 Cr and reported Net Sales of 3.19 Cr and a Net Profit of 1.25 Cr in the latest four quarters; specific values for Shareholder's Funds and Total Assets are unavailable.

As of 24th July, Omnitex Industries (India) Ltd has a market capitalization of 229.00 Cr, categorized as a Micro Cap.<BR><BR>In the latest four quarters, the company reported Net Sales of 3.19 Cr and a Net Profit of 1.25 Cr.<BR><BR>The reporting period for the balance sheet is the latest annual period, but specific values for Shareholder's Funds and Total Assets are unavailable.

Read More

Are Omnitex Industri latest results good or bad?

25-Jul-2025

Omnitex Industries' latest results are concerning, showing a decline in key metrics with an operating profit of Rs -0.08 crore and a profit before tax of Rs -0.09 crore. The company is heavily reliant on non-operating income, leading to a 'Sell' rating by MarketsMOJO and a negative outlook overall.

The latest results for Omnitex Industries indicate a challenging financial situation. For the quarter ending March 2025, the company's performance has been flat, with key metrics showing a decline. The operating profit (PBDIT) is at Rs -0.08 crore, marking the lowest figure in the last five quarters, and the profit before tax (PBT) is similarly low at Rs -0.09 crore.<BR><BR>Moreover, the company is heavily reliant on non-operating income, which makes up over 100% of its profit before tax. This reliance raises concerns about the sustainability of its business model. Earnings per share (EPS) have also declined to Rs -3.43, indicating reduced profitability for shareholders. Given these factors, the stock is currently rated as a 'Sell' by MarketsMOJO.<BR><BR>Overall, the results suggest that Omnitex Industries is facing significant financial difficulties, and the outlook appears negative.

Read More

When is the next results date for Omnitex Industri?

12-Nov-2025

The next results date for Omnitex Industri is 14 November 2025.

The next results date for Omnitex Industri is scheduled for 14 November 2025.

Read More

How has been the historical performance of Omnitex Industri?

14-Nov-2025

Omnitex Industri reported no revenue for the year ending March 2008, with a modest profit before tax of 0.13 and negative cash flow from operations at -0.08, indicating challenges in revenue generation and cash flow management.

Answer:<BR>The historical performance of Omnitex Industri shows a modest financial position for the year ending March 2008.<BR><BR>Breakdown:<BR>In March 2008, Omnitex Industri reported net sales and total operating income of 0.00, indicating no revenue generation during that period. The total expenditure, excluding depreciation, was recorded at 0.10, leading to an operating profit (PBDIT) of 0.18 after accounting for other income of 0.28. The profit before tax stood at 0.13, which translated into a profit after tax of 0.13 as well. The company had an earnings per share (EPS) of 0.3, with a PAT margin of 0.0%. The cash flow from operating activities was negative at -0.08, while cash flow from investing activities was slightly positive at 0.01. The net cash outflow was -0.07, resulting in a closing cash and cash equivalent of 0.12. Overall, the financial metrics reflect a company that, while generating a small profit, faced challenges in revenue generation and cash flow management.

Read More

Should I buy, sell or hold Omnitex Industri?

16-Nov-2025

Why is Omnitex Industri falling/rising?

04-Dec-2025

As of 04-Dec, Omnitex Industries (India) Ltd's stock price is currently 553.55, reflecting a decline of 1.5% and a total drop of 3.47% over the last two days. Despite strong year-to-date and annual performances, recent trends indicate a downturn with negative market sentiment.

As of 04-Dec, Omnitex Industries (India) Ltd's stock price is falling, currently at 553.55, which reflects a decrease of 8.45 points or 1.5%. The stock has underperformed its sector by 1.09% today and has been on a consecutive decline for the last two days, resulting in a total drop of 3.47% during this period. Over the past week, the stock has decreased by 2.23%, while the benchmark Sensex has only fallen by 0.53%. <BR><BR>Despite a strong year-to-date performance of 95.01% and a remarkable 133.57% increase over the past year, the recent trends indicate a downturn. The stock is currently trading higher than its 20-day, 50-day, 100-day, and 200-day moving averages, but it is lower than its 5-day moving average, suggesting a short-term weakness. Additionally, while there has been a rise in investor participation, with delivery volume increasing by 66.33% against the 5-day average, the overall market sentiment appears to be negative, contributing to the stock's decline.

Read More
iScoreScore
Click here to find our call on this stock
Strong Sell
Sell
Hold
Buy
Strong Buy

MarketsMojo — Loved in India, Now Global

The power of Mojo is now in 29 countries. Explore global equities with the same cutting-edge features you love.

Dashboard
1

With a Operating Losses, the company has a Weak Long Term Fundamental Strength

  • Company's ability to service its debt is weak with a poor EBIT to Interest (avg) ratio of -0.24
  • The company has reported losses. Due to this company has reported negative ROCE
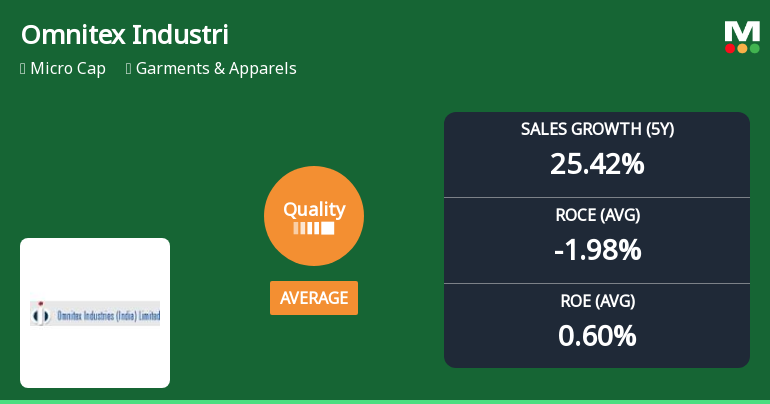
2

Flat results in Sep 25

3

Risky - Negative EBITDA

4

Reducing Promoter Confidence

stock-summaryMojo Parameters
Mojo Parameters
Loading Valuation Snapshot...
Stock DNA
stock-summary
Industry

Garments & Apparels

stock-summary
Market cap

INR 236 Cr (Micro Cap)

stock-summary
P/E

83.00

stock-summary
Industry P/E

52

stock-summary
Dividend Yield

0.00%

stock-summary
Debt Equity

-0.01

stock-summary
Return on Equity

1.59%

stock-summary
Price to Book

1.33

Revenue and Profits:
Net Sales:
0 Cr
(Quarterly Results - Sep 2025)
Net Profit:
0 Cr
stock-summaryTotal Returns
Total Returns (Price + Dividend) stock-summary
Dividend Yield (0%)
TimePeriod
Price Return
Dividend Return
Total Return
3 Months
43.41%
0%
43.41%
6 Months
73.53%
0%
73.53%
1 Year
122.44%
0%
122.44%
2 Years
0%
10.90%
10.9%
3 Years
1317.54%
0%
1317.54%
4 Years
0%
27.97%
27.97%
5 Years
2738.72%
0%
2738.72%

Latest dividend: 8 per share ex-dividend date: Aug-20-2024

Risk Adjusted Returns v/s stock-summary
Returns Beta
Icon
Beta has not been calculated since enough price history is not available
stock-summaryNews & Corporate Actions
Announcements stock-summary

Board Meeting Outcome for Outcome Of Board Meeting Held On 14Th November 2025

14-Nov-2025 | Source : BSE

Outcome of Board Meeting

Financial Results For The Quarter And Half Year Ended 30Th September 2025.

14-Nov-2025 | Source : BSE

Financial Results for the quarter and half year ended 30th September 2025.

Intimation Of Receipt Of Request For Reclassification From Promoter/Promoter Group To The Public Category In Accordance With Regulation 31A Of The Securities And Exchange Board Of India (Listing Obligations And Disclosure Requirements) Regulations 2015.

13-Nov-2025 | Source : BSE

Intimation of receipt of request for reclassification from Promoter/Promoter Group to the Public category in accordance with Regulation 31A of the Securities and Exchange Board of India (Listing Obligation and Disclosure Requirements) Regulations 2015.

Corporate Actions stock-summary
stock-summary
BOARD MEETING

No Upcoming Board Meetings

stock-summary
DIVIDEND

Omnitex Industries (India) Ltd has declared 80% dividend, ex-date: 20 Aug 24

stock-summary
SPLITS

No Splits history available

stock-summary
BONUS

No Bonus history available

stock-summary
RIGHTS

No Rights history available

stock-summaryKey Factors
Quality key factors stock-summary
Factor
Value
Sales Growth (5y)
17.19%
EBIT Growth (5y)
-2.97%
EBIT to Interest (avg)
-0.24
Debt to EBITDA (avg)
Negative Net Debt
Net Debt to Equity (avg)
-0.01
Sales to Capital Employed (avg)
0.09
Tax Ratio
83.89%
Dividend Payout Ratio
0
Pledged Shares
0
Institutional Holding
2.12%
ROCE (avg)
-2.38%
ROE (avg)
0.64%
Valuation key factors
Factor
Value
P/E Ratio
83
Industry P/E
52
Price to Book Value
1.31
EV to EBIT
-231.81
EV to EBITDA
-231.81
EV to Capital Employed
1.31
EV to Sales
155.58
PEG Ratio
2.08
Dividend Yield
NA
ROCE (Latest)
-0.25%
ROE (Latest)
1.59%
Technicals key factors
Indicator
Weekly
Monthly
MACD
Bullish
Bullish
RSI
No Signal
No Signal
Bollinger Bands
Mildly Bullish
Mildly Bullish
Moving Averages
Bullish (Daily)
KST
Bullish
Mildly Bearish
Dow Theory
No Trend
No Trend
stock-summary Technical Indicator Scale: Bearish, Mildly Bearish, Sideways, Mildly Bullish, Bullish  Turned 
stock-summaryShareholding
Shareholding Snapshot : Sep 2025stock-summary
Shareholding Compare (%holding) stock-summary
Majority shareholders

Non Institution

Pledged Promoter Holdings

None

Mutual Funds

Held by 1 Schemes (0.0%)

FIIs

Held by 1 FIIs (2.12%)

Promoter with highest holding

Ashok Metharam Bhawnani (22.01%)

Highest Public shareholder

Citoc Ventures Private Limited (19.5%)

Individual Investors Holdings

22.5%

stock-summaryFinancial
[
  {
    "link": "quarterly",
    "btn_text": "All Quarterly Results",
    "header": "Quarterly Results Snapshot (Standalone) - Sep'25 - QoQ",
    "rhs": [
      {
        "prefix": "Net Sales ",
        "suffix": "QoQ Growth in quarter ended Sep 2025 is -40.74% vs 92.86% in Jun 2025",
        "dir": -1
      },
      {
        "prefix": "Standalone Net Profit ",
        "suffix": "QoQ Growth in quarter ended Sep 2025 is -102.33% vs 218.62% in Jun 2025",
        "dir": -1
      }
    ],
    "table": {
      "header": [
        "Sep'25",
        "Jun'25",
        "Change(%)"
      ],
      "body": [
        {
          "field": "Net Sales",
          "val1": "0.16",
          "val2": "0.27",
          "chgp": "-40.74%",
          "chgp_class": "negative"
        },
        {
          "field": "Operating Profit (PBDIT) excl Other Income",
          "val1": "-0.19",
          "val2": "-0.15",
          "chgp": "-26.67%",
          "chgp_class": "negative"
        },
        {
          "field": "Interest",
          "val1": "0.00",
          "val2": "0.00",
          "chgp": "",
          "chgp_class": "neutral"
        },
        {
          "field": "Exceptional Items",
          "val1": "0.00",
          "val2": "0.00",
          "chgp": "",
          "chgp_class": "neutral"
        },
        {
          "field": "Standalone Net Profit",
          "val1": "-0.04",
          "val2": "1.72",
          "chgp": "-102.33%",
          "chgp_class": "negative"
        },
        {
          "field": "Operating Profit Margin (Excl OI)",
          "val1": "-118.75%",
          "val2": "-55.56%",
          "chgp": "-63.19%",
          "chgp_class": "negative"
        }
      ]
    }
  },
  {
    "link": "half-yearly",
    "btn_text": "All Half Yearly Results",
    "header": "Half Yearly Results Snapshot (Standalone) - Sep'25",
    "rhs": [
      {
        "prefix": "Net Sales ",
        "suffix": " Growth in half year ended Sep 2025 is -80.28% vs 249.18% in Sep 2024",
        "dir": -1
      },
      {
        "prefix": "Standalone Net Profit ",
        "suffix": " Growth in half year ended Sep 2025 is -37.08% vs 60.84% in Sep 2024",
        "dir": -1
      }
    ],
    "table": {
      "header": [
        "Sep'25",
        "Sep'24",
        "Change(%)"
      ],
      "body": [
        {
          "field": "Net Sales",
          "val1": "0.42",
          "val2": "2.13",
          "chgp": "-80.28%",
          "chgp_class": "negative"
        },
        {
          "field": "Operating Profit (PBDIT) excl Other Income",
          "val1": "-0.35",
          "val2": "-0.04",
          "chgp": "-775.00%",
          "chgp_class": "negative"
        },
        {
          "field": "Interest",
          "val1": "0.00",
          "val2": "0.00",
          "chgp": "",
          "chgp_class": "neutral"
        },
        {
          "field": "Exceptional Items",
          "val1": "0.00",
          "val2": "2.56",
          "chgp": "-100.00%",
          "chgp_class": "negative"
        },
        {
          "field": "Standalone Net Profit",
          "val1": "1.68",
          "val2": "2.67",
          "chgp": "-37.08%",
          "chgp_class": "negative"
        },
        {
          "field": "Operating Profit Margin (Excl OI)",
          "val1": "-83.33%",
          "val2": "-1.88%",
          "chgp": "-81.45%",
          "chgp_class": "negative"
        }
      ]
    }
  },
  {
    "link": "nine-monthly",
    "btn_text": "All Nine Monthly Results",
    "header": "Nine Monthly Results Snapshot (Standalone) - Dec'24",
    "rhs": [
      {
        "prefix": "Net Sales ",
        "suffix": "YoY Growth in nine months ended Dec 2024 is 174.77% vs 0.00% in Dec 2023",
        "dir": 1
      },
      {
        "prefix": "Standalone Net Profit ",
        "suffix": "YoY Growth in nine months ended Dec 2024 is 61.08% vs 1,213.33% in Dec 2023",
        "dir": -1
      }
    ],
    "table": {
      "header": [
        "Dec'24",
        "Dec'23",
        "Change(%)"
      ],
      "body": [
        {
          "field": "Net Sales",
          "val1": "3.05",
          "val2": "1.11",
          "chgp": "174.77%",
          "chgp_class": "positive"
        },
        {
          "field": "Operating Profit (PBDIT) excl Other Income",
          "val1": "-0.06",
          "val2": "-0.10",
          "chgp": "40.00%",
          "chgp_class": "positive"
        },
        {
          "field": "Interest",
          "val1": "0.00",
          "val2": "0.00",
          "chgp": "",
          "chgp_class": "neutral"
        },
        {
          "field": "Exceptional Items",
          "val1": "2.56",
          "val2": "2.01",
          "chgp": "27.36%",
          "chgp_class": "positive"
        },
        {
          "field": "Standalone Net Profit",
          "val1": "2.69",
          "val2": "1.67",
          "chgp": "61.08%",
          "chgp_class": "positive"
        },
        {
          "field": "Operating Profit Margin (Excl OI)",
          "val1": "-1.97%",
          "val2": "-9.01%",
          "chgp": "7.04%",
          "chgp_class": "positive"
        }
      ]
    }
  },
  {
    "link": "annual",
    "btn_text": "All Annual Results",
    "header": "Annual Results Snapshot (Standalone) - Mar'25",
    "rhs": [
      {
        "prefix": "Net Sales ",
        "suffix": "YoY Growth in year ended Mar 2025 is 87.65% vs 400.00% in Mar 2024",
        "dir": -1
      },
      {
        "prefix": "Standalone Net Profit ",
        "suffix": "YoY Growth in year ended Mar 2025 is -64.49% vs 1,776.19% in Mar 2024",
        "dir": -1
      }
    ],
    "table": {
      "header": [
        "Mar'25",
        "Mar'24",
        "Change(%)"
      ],
      "body": [
        {
          "field": "Net Sales",
          "val1": "3.19",
          "val2": "1.70",
          "chgp": "87.65%",
          "chgp_class": "positive"
        },
        {
          "field": "Operating Profit (PBDIT) excl Other Income",
          "val1": "-0.15",
          "val2": "-0.12",
          "chgp": "-25.00%",
          "chgp_class": "negative"
        },
        {
          "field": "Interest",
          "val1": "0.00",
          "val2": "0.00",
          "chgp": "",
          "chgp_class": "neutral"
        },
        {
          "field": "Exceptional Items",
          "val1": "0.00",
          "val2": "2.02",
          "chgp": "-100.00%",
          "chgp_class": "negative"
        },
        {
          "field": "Standalone Net Profit",
          "val1": "1.25",
          "val2": "3.52",
          "chgp": "-64.49%",
          "chgp_class": "negative"
        },
        {
          "field": "Operating Profit Margin (Excl OI)",
          "val1": "-4.70%",
          "val2": "-7.06%",
          "chgp": "2.36%",
          "chgp_class": "positive"
        }
      ]
    }
  }
]
Quarterly Results Snapshot (Standalone) - Sep'25 - QoQstock-summary
Sep'25
Jun'25
Change(%)
Net Sales
0.16
0.27
-40.74%
Operating Profit (PBDIT) excl Other Income
-0.19
-0.15
-26.67%
Interest
0.00
0.00
Exceptional Items
0.00
0.00
Standalone Net Profit
-0.04
1.72
-102.33%
Operating Profit Margin (Excl OI)
-118.75%
-55.56%
-63.19%
Values in Rs Cr.
Direction Arrows
Net Sales

QoQ Growth in quarter ended Sep 2025 is -40.74% vs 92.86% in Jun 2025

Direction Arrows
Standalone Net Profit

QoQ Growth in quarter ended Sep 2025 is -102.33% vs 218.62% in Jun 2025

Half Yearly Results Snapshot (Standalone) - Sep'25stock-summary
Sep'25
Sep'24
Change(%)
Net Sales
0.42
2.13
-80.28%
Operating Profit (PBDIT) excl Other Income
-0.35
-0.04
-775.00%
Interest
0.00
0.00
Exceptional Items
0.00
2.56
-100.00%
Standalone Net Profit
1.68
2.67
-37.08%
Operating Profit Margin (Excl OI)
-83.33%
-1.88%
-81.45%
Values in Rs Cr.
Direction Arrows
Net Sales

Growth in half year ended Sep 2025 is -80.28% vs 249.18% in Sep 2024

Direction Arrows
Standalone Net Profit

Growth in half year ended Sep 2025 is -37.08% vs 60.84% in Sep 2024

Nine Monthly Results Snapshot (Standalone) - Dec'24stock-summary
Dec'24
Dec'23
Change(%)
Net Sales
3.05
1.11
174.77%
Operating Profit (PBDIT) excl Other Income
-0.06
-0.10
40.00%
Interest
0.00
0.00
Exceptional Items
2.56
2.01
27.36%
Standalone Net Profit
2.69
1.67
61.08%
Operating Profit Margin (Excl OI)
-1.97%
-9.01%
7.04%
Values in Rs Cr.
Direction Arrows
Net Sales

YoY Growth in nine months ended Dec 2024 is 174.77% vs 0.00% in Dec 2023

Direction Arrows
Standalone Net Profit

YoY Growth in nine months ended Dec 2024 is 61.08% vs 1,213.33% in Dec 2023

Annual Results Snapshot (Standalone) - Mar'25stock-summary
Mar'25
Mar'24
Change(%)
Net Sales
3.19
1.70
87.65%
Operating Profit (PBDIT) excl Other Income
-0.15
-0.12
-25.00%
Interest
0.00
0.00
Exceptional Items
0.00
2.02
-100.00%
Standalone Net Profit
1.25
3.52
-64.49%
Operating Profit Margin (Excl OI)
-4.70%
-7.06%
2.36%
Values in Rs Cr.
Direction Arrows
Net Sales

YoY Growth in year ended Mar 2025 is 87.65% vs 400.00% in Mar 2024

Direction Arrows
Standalone Net Profit

YoY Growth in year ended Mar 2025 is -64.49% vs 1,776.19% in Mar 2024

stock-summaryCompany CV
About Omnitex Industries (India) Ltd stock-summary
stock-summary
Omnitex Industries (India) Ltd
Micro Cap
Garments & Apparels
Omnitex Industries (India) Limited, incorporated in 1987 is engaged in trading of fabrics and yarn. In the past decade, the Company promoted a successful joint venture with a foreign partner into the field of technical textiles and infrastructure development. In 2010, the Company disposed off the land and building at Silvassa. It had no manufacturing activities so it purchased and sold 1,00,299 meters of fabrics. It had a 33.
Company Coordinates stock-summary
Company Details
Sabnam House Plot No A 15/16, Central Cr Rd-B MIDC Andheri-E Mumbai Maharashtra : 400093
stock-summary
Tel:
stock-summary
info@omitex.com
Registrar Details
Adroit Corporate Services Pvt Ltd, 17-20 Jaferbhoy Industrial Estate , 1st Floor, Makwana Road, Marol Naka, Mumbai