
Stock DNA
Pharmaceuticals & Biotechnology
USD 4 Million (Micro Cap)
NA
0.00%
1.33
-999,999.00%
0.65
Total Returns (Price + Dividend) 
Onconetix, Inc. for the last several years.
Risk Adjusted Returns v/s
News
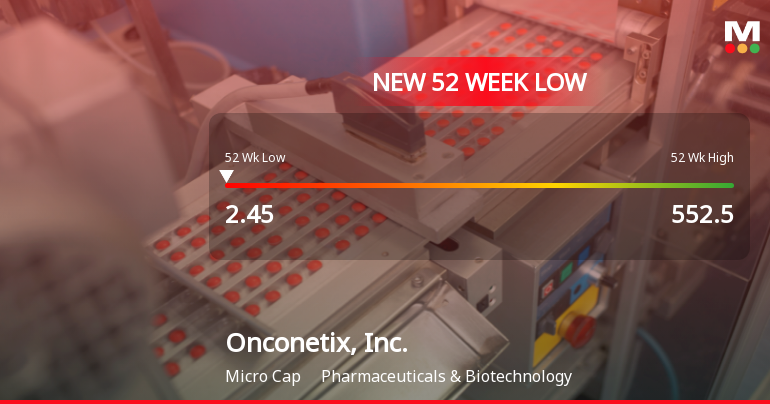
Onconetix, Inc. Hits New 52-Week Low at $2.45 Amid Major Decline
Onconetix, Inc., a microcap pharmaceutical company, recently hit a 52-week low, reflecting a significant decline in performance over the past year. With a market capitalization of around USD 4 million, the company faces challenges, including a low price-to-book ratio and a concerning debt-to-equity ratio, raising questions about its financial stability.
Read MoreIs Onconetix, Inc. technically bullish or bearish?
As of 12 September 2025, the technical trend for Onconetix, Inc. has changed from mildly bullish to mildly bearish. The current stance is mildly bearish, driven by daily moving averages indicating bearishness and weekly Bollinger Bands also showing a bearish signal. While the MACD remains mildly bullish on both weekly and monthly time frames, the overall trend is tempered by the bearish signals from the moving averages and Bollinger Bands. The stock has significantly underperformed compared to the S&P 500, with a year-to-date return of -94.4% versus the S&P's 12.22%....
Read MoreIs Onconetix, Inc. overvalued or undervalued?
As of 29 August 2024, the valuation grade for Onconetix, Inc. has moved from does not qualify to risky, indicating a significant shift in its perceived investment quality. The company appears to be overvalued given its negative P/E ratio of -0.4976 and an EV to EBITDA ratio of -1.7044, which suggest that the market is pricing the stock unfavorably compared to its earnings potential. Additionally, the lack of a PEG ratio indicates that growth expectations may not justify the current valuation. In comparison to peers, Onconetix, Inc. is underperforming, especially when contrasted with the broader industry metrics. For instance, while Onconetix has a negative P/E, other companies in the pharmaceuticals and biotechnology sector typically exhibit positive valuations. The recent stock performance further underscores this valuation concern, as Onconetix has seen a staggering YTD return of -94.4% compared to a 12....
Read More Announcements

Corporate Actions
Quality key factors
Valuation key factors
Technicals key factors
 Technical Indicator Scale: Bearish, Mildly Bearish, Sideways, Mildly Bullish, Bullish Turned
 Shareholding Snapshot : Dec 2024
Shareholding Compare (%holding)
Foreign Institutions
Held in 3 Schemes (0.74%)
Held by 6 Foreign Institutions (2.71%)
Quarterly Results Snapshot (Consolidated) - Jun'25 - YoY

YoY Growth in quarter ended Jun 2025 is -85.71% vs 0.00% in Jun 2024

YoY Growth in quarter ended Jun 2025 is 83.22% vs -107.25% in Jun 2024
Annual Results Snapshot (Consolidated) - Dec'24
YoY Growth in year ended Dec 2024 is 2,400.00% vs 0.00% in Dec 2023
YoY Growth in year ended Dec 2024 is -56.95% vs -179.10% in Dec 2023
About Onconetix, Inc.

Company Coordinates


