
Compare One Global Serv with Similar Stocks
Dashboard
Company has a Debt to Equity ratio (avg) of 0.02 times
Healthy long term growth as Net Sales has grown by an annual rate of 167.13% and Operating profit at 108.50%
With a growth in Net Sales of 141.27%, the company declared Very Positive results in Mar 26
With ROE of 49.2, it has a Fair valuation with a 8.1 Price to Book Value
Increasing Participation by Institutional Investors
Stock DNA
Healthcare Services
INR 1,153 Cr (Micro Cap)
16.00
25
0.00%
-0.11
49.18%
8.20
Total Returns (Price + Dividend) 
Latest dividend: 1 per share ex-dividend date: Sep-23-2024
Risk Adjusted Returns v/s
Returns Beta

News

One Global Service Provider Ltd Downgraded to Hold Amid Mixed Technical and Valuation Signals
One Global Service Provider Ltd, a micro-cap player in the Healthcare Services sector, has seen its investment rating downgraded from Buy to Hold as of 28 July 2026. This adjustment reflects a nuanced shift across multiple evaluation parameters including technical trends, valuation metrics, financial performance, and overall quality assessment.
Read full news article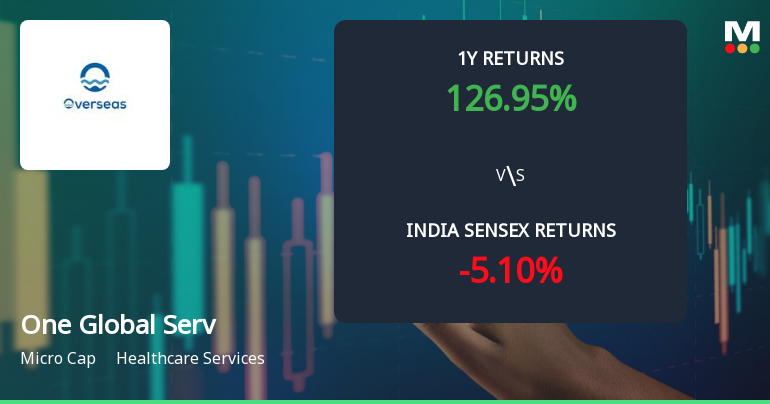
One Global Service Provider Ltd Sees Technical Momentum Shift Amid Mixed Signals
One Global Service Provider Ltd, a micro-cap player in the Healthcare Services sector, has experienced a notable shift in its technical momentum, moving from a bullish to a mildly bullish stance. Despite a recent downgrade in its Mojo Grade from Buy to Hold, the stock’s technical indicators present a nuanced picture that investors should carefully analyse amid broader market conditions.
Read full news article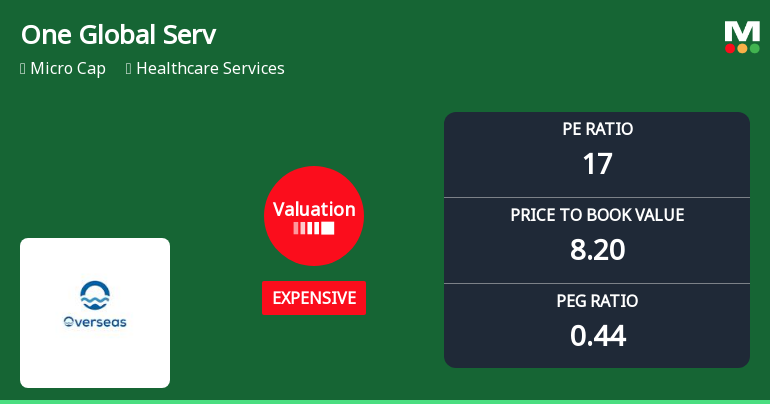
One Global Service Provider Ltd Valuation Shifts Signal Price Attractiveness Change
One Global Service Provider Ltd, a micro-cap player in the Healthcare Services sector, has seen a notable shift in its valuation parameters, moving from fair to expensive territory. This change in price attractiveness, reflected in key metrics such as the price-to-earnings (P/E) and price-to-book value (P/BV) ratios, warrants a detailed examination against historical trends and peer comparisons to assess its implications for investors.
Read full news article Announcements
Compliances-Certificate under Reg. 74 (5) of SEBI (DP) Regulations 2018
10-Jul-2026 | Source : BSEWe hereby Submit the certificate under Regulation 74 (5) of SEBI (DP) Regulation 2018 for the quarter ended 30th June 2026.
Closure of Trading Window
25-Jun-2026 | Source : BSEClosure of Trading Window of Unaudited Financial Results for the quarter ending 30th June 2026
Board Meeting Outcome for Revised Outcome
03-Jun-2026 | Source : BSERevised outcome for Audited Standalone financial statements for the quarter and year ending 31st March 2026
Corporate Actions

No Upcoming Board Meetings

One Global Service Provider Ltd has declared 10% dividend, ex-date: 23 Sep 24

No Splits history available

No Bonus history available

No Rights history available
Quality key factors
Valuation key factors
Technicals key factors
 Technical Indicator Scale: Bearish, Mildly Bearish, Sideways, Mildly Bullish, Bullish Turned
 Shareholding Snapshot : Jun 2026
Shareholding Compare (%holding)
Promoters
None
Held by 0 Schemes
Held by 5 FIIs (7.72%)
Sona V Dhawangale (66.24%)
Terentia Consultants Private Limited (5.38%)
15.32%
Quarterly Results Snapshot (Standalone) - Mar'26 - YoY

YoY Growth in quarter ended Mar 2026 is 141.27% vs 128.23% in Mar 2025

YoY Growth in quarter ended Mar 2026 is 65.36% vs 177.08% in Mar 2025
Half Yearly Results Snapshot (Standalone) - Sep'25
Growth in half year ended Sep 2025 is 575.80% vs 36.41% in Sep 2024
Growth in half year ended Sep 2025 is 636.57% vs 140.72% in Sep 2024
Nine Monthly Results Snapshot (Standalone) - Dec'25
YoY Growth in nine months ended Dec 2025 is 448.81% vs 71.38% in Dec 2024
YoY Growth in nine months ended Dec 2025 is 583.60% vs 139.62% in Dec 2024
Annual Results Snapshot (Standalone) - Mar'26
YoY Growth in year ended Mar 2026 is 238.81% vs 133.36% in Mar 2025
YoY Growth in year ended Mar 2026 is 276.29% vs 159.77% in Mar 2025
About One Global Service Provider Ltd

Company Coordinates


