
Compare One Global Serv with Similar Stocks
Dashboard
Company has a Debt to Equity ratio (avg) of 0.02 times
Healthy long term growth as Net Sales has grown by an annual rate of 167.13% and Operating profit at 108.50%
With a growth in Net Sales of 141.27%, the company declared Very Positive results in Mar 26
With ROE of 49.2, it has a Expensive valuation with a 8.8 Price to Book Value
Despite the size of the company, domestic mutual funds hold only 0% of the company
Stock DNA
Healthcare Services
INR 1,198 Cr (Micro Cap)
18.00
23
0.00%
-0.11
49.18%
8.36
Total Returns (Price + Dividend) 
Latest dividend: 1 per share ex-dividend date: Sep-23-2024
Risk Adjusted Returns v/s
Returns Beta

News
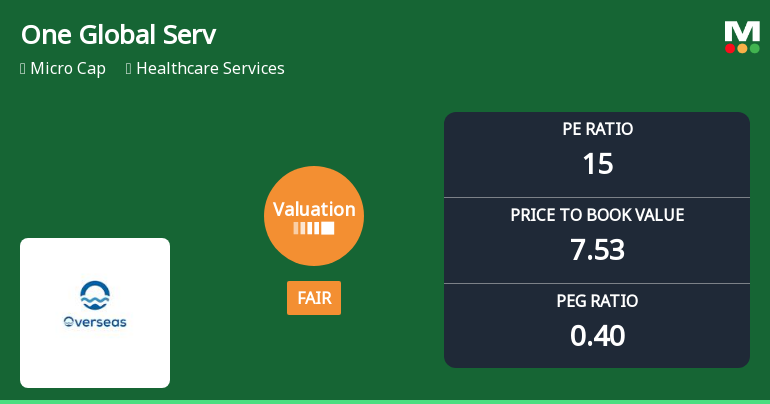
One Global Service Provider Ltd Valuation Shifts Signal Changing Market Sentiment
One Global Service Provider Ltd, a micro-cap player in the Healthcare Services sector, has recently undergone a notable shift in its valuation parameters, moving from an expensive to a fair valuation grade. This article examines the implications of this change, analysing key valuation metrics such as the price-to-earnings (P/E) and price-to-book value (P/BV) ratios in comparison to historical trends and peer averages, while also considering the company’s operational performance and market returns.
Read full news article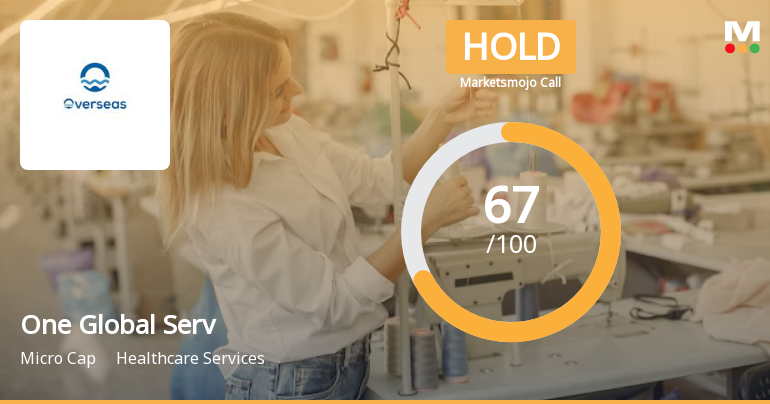
One Global Service Provider Ltd is Rated Hold
One Global Service Provider Ltd is rated 'Hold' by MarketsMOJO, with this rating last updated on 25 May 2026. However, the analysis and financial metrics discussed here reflect the stock's current position as of 08 June 2026, providing investors with an up-to-date view of the company’s fundamentals, returns, and market standing.
Read full news article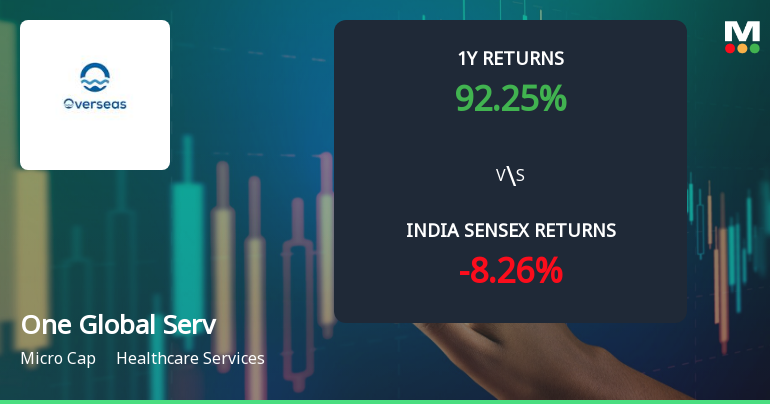
One Global Service Provider Ltd Shows Mixed Technical Signals Amid Mildly Bullish Momentum
One Global Service Provider Ltd, a micro-cap player in the Healthcare Services sector, has experienced a notable shift in its technical momentum, moving from a sideways trend to a mildly bullish stance. Despite mixed signals from key indicators such as MACD, RSI, and moving averages, the stock’s recent price action and technical parameters suggest cautious optimism for investors navigating this evolving landscape.
Read full news article Announcements
Board Meeting Outcome for Revised Outcome
03-Jun-2026 | Source : BSERevised outcome for Audited Standalone financial statements for the quarter and year ending 31st March 2026
Announcement under Regulation 30 (LODR)-Newspaper Publication
03-Jun-2026 | Source : BSENewspaper Publication of Audited financial results for quarter and year ended 31st March 2026.
Financial Results For Quarter And Year Ended 31St March 2026
03-Jun-2026 | Source : BSETo consider and approve Audited standalone financial statements for the quarter and year ended 31st March 2026.
Corporate Actions

No Upcoming Board Meetings

One Global Service Provider Ltd has declared 10% dividend, ex-date: 23 Sep 24

No Splits history available

No Bonus history available

No Rights history available
Quality key factors
Valuation key factors
Technicals key factors
 Technical Indicator Scale: Bearish, Mildly Bearish, Sideways, Mildly Bullish, Bullish Turned
 Shareholding Snapshot : Mar 2026
Shareholding Compare (%holding)
Promoters
None
Held by 0 Schemes
Held by 3 FIIs (5.44%)
Sona V Dhawangale (66.24%)
Terentia Consultants Private Limited (5.38%)
16.35%
Quarterly Results Snapshot (Standalone) - Mar'26 - YoY

YoY Growth in quarter ended Mar 2026 is 141.27% vs 128.23% in Mar 2025

YoY Growth in quarter ended Mar 2026 is 65.36% vs 177.08% in Mar 2025
Half Yearly Results Snapshot (Standalone) - Sep'25
Growth in half year ended Sep 2025 is 575.80% vs 36.41% in Sep 2024
Growth in half year ended Sep 2025 is 636.57% vs 140.72% in Sep 2024
Nine Monthly Results Snapshot (Standalone) - Dec'25
YoY Growth in nine months ended Dec 2025 is 448.81% vs 71.38% in Dec 2024
YoY Growth in nine months ended Dec 2025 is 583.60% vs 139.62% in Dec 2024
Annual Results Snapshot (Standalone) - Mar'26
YoY Growth in year ended Mar 2026 is 238.81% vs 133.36% in Mar 2025
YoY Growth in year ended Mar 2026 is 276.29% vs 159.77% in Mar 2025
About One Global Service Provider Ltd

Company Coordinates


