One Point One

  • Market Cap: Micro Cap
  • Industry: Commercial Services & Supplies
  • ISIN: INE840Y01029
  • NSEID: ONEPOINT
  • BSEID: 544748
INR
57.73
-0.41 (-0.71%)
BSENSE

Jun 25, 03:30 PM

BSE+NSE Vol: 5.2 lacs

  • Price Points
  • Score
  • Mojo Parameters
  • Total Return
  • News and Corporate Actions
  • Key factors
  • Shareholding
  • Financials
  • CompanyCV
stock-summaryPrice Point
High/Low

1Day

52 Week

Valuation
Technical
Day's Volume

CASH

5.2 lacs (-24.98%) Volume

Shareholding (Mar 2026)

FII

7.02%

Held by 13 FIIs

DII

2.84%

Held by 3 DIIs

Promoter

52.29%

Why is One Point One Solutions Ltd falling/rising?

26-Jun-2026

As of 25-Jun, One Point One Solutions Ltd's stock price is declining at 57.73, down -0.71%, with a notable drop in investor participation and trading volume. The stock is consistently below its moving averages, indicating a sustained downward trend over the past month.

As of 25-Jun, One Point One Solutions Ltd is experiencing a decline in its stock price, currently at 57.73, which reflects a change of -0.41 or -0.71%. This downward movement is evident in the stock's performance over various periods, showing a 1-week decline of -2.37% compared to a slight decrease of -0.40% in the Sensex. Over the past month, the stock has fallen by -5.53%, while the Sensex has increased by +0.80%. <BR><BR>The stock is also trading below its moving averages across multiple time frames, including the 5-day, 20-day, 50-day, 100-day, and 200-day averages, indicating a consistent downward trend. Additionally, there has been a significant drop in investor participation, with delivery volume on June 24 falling by -45.83% against the 5-day average. This decline in trading activity suggests reduced interest from investors, further contributing to the stock's negative performance. Overall, these factors collectively explain the falling price of One Point One Solutions Ltd.

View full answer

Should I buy, sell or hold One Point One Solutions Ltd?

23-Jun-2026

What does One Point One do?

11-Jun-2026

One Point One Solutions Ltd is a Micro Cap company in the Commercial Services & Supplies industry, with reported net sales of 96 Cr and a net profit of 10 Cr for the quarter ending March 2026. The company, originally founded in 2008, has a market cap of INR 1,483 Cr and key metrics including a P/E ratio of 38.00 and a debt-equity ratio of 0.36.

Overview:<BR>One Point One Solutions Ltd operates in the Commercial Services & Supplies industry and is classified as a Micro Cap company.<BR><BR>History:<BR>The company was originally incorporated in 2008 as DSA Learning Systems Private Limited. It changed its name to One Point One Solutions Private Limited in 2013 and became a Public Limited Company, adopting the name One Point One Solutions Limited in 2017. The latest reported quarter for sales and profit is March 2026.<BR><BR>Financial Snapshot:<BR>Net Sales: 96 Cr (Quarterly Results - Mar 2026)<BR>Net Profit: 10 Cr (Quarterly Results - Mar 2026)<BR>Market Cap: INR 1,483 Cr (Micro Cap)<BR><BR>Key Metrics:<BR>P/E: 38.00<BR>Industry P/E: 23<BR>Dividend Yield: 0.00%<BR>Debt-Equity: 0.36<BR>Return on Equity: 8.79%<BR>Price to Book: 3.23<BR><BR>Contact Details:<BR>Address: International Infotech Park, T-762 Tower-7 Vashi Navi Mumbai Maharashtra : 400703<BR>Tel: 91-22-61656363<BR>Email: investors@1point1.in<BR>Website: http://www.1point1.in

View full answer

How big is One Point One?

11-Jun-2026

As of 10th June, One Point One Solutions Ltd has a market capitalization of 1,483.00 Cr, with recent net sales of 313.38 Cr and a net profit of 38.25 Cr over the latest four quarters.

As of 10th June, <BR><BR>Market Cap: One Point One Solutions Ltd has a market capitalization of 1,483.00 Cr and is classified as a Micro Cap.<BR><BR>Recent Quarterly Performance: The sum of Net Sales for the latest 4 quarters is 313.38 Cr, while the sum of Net Profit for the same period is 38.25 Cr.<BR><BR>Balance Sheet Snapshot: The reporting period for the latest annual data is March 2025. Shareholder's Funds are valued at 404.98 Cr, and Total Assets amount to 497.76 Cr.

View full answer

Who are in the management team of One Point One?

11-Jun-2026

The management team of One Point One includes Akshay Chhabra (Chairman/Executive Director), Akashanand Karnik (Executive Director), and four Independent Non-Executive Directors: Bharat Dighe, Chandrasekher Yerramalli, Arjun Sanjeev Bhatia, and Shalini Pritamdasani. Chhabra and Karnik receive remuneration, while the independent directors do not.

The management team of One Point One includes the following individuals:<BR><BR>1. **Akshay Chhabra** - Chairman / Executive Director, with a remuneration of 67.0 lacs INR.<BR>2. **Akashanand Karnik** - Executive Director & Wholetime Director, with a remuneration of 49.67 lacs INR.<BR>3. **Bharat Dighe** - Independent Non-Executive Director, with no remuneration.<BR>4. **Chandrasekher Yerramalli** - Independent Non-Executive Director, with no remuneration.<BR>5. **Arjun Sanjeev Bhatia** - Independent Non-Executive Director, with no remuneration.<BR>6. **Shalini Pritamdasani** - Independent Non-Executive Director, with no remuneration.<BR><BR>This team is responsible for overseeing the company's operations and strategic direction.

View full answer

Who are the peers of the One Point One?

11-Jun-2026

One Point One's peers include Firstsour.Solu., eClerx Services, RPSG Ventures, Hinduja Global, Alldigi Tech, Digitide Solutio, Unified Data, Qualitek Labs, and Tracxn Technolo. Management risk varies from excellent at eClerx to below average at One Point One and Qualitek Labs, with growth ratings ranging from excellent at RPSG Ventures to below average at eClerx and Tracxn.

Peers: The peers of One Point One are Firstsour.Solu., eClerx Services, RPSG Ventures, Hinduja Global, Alldigi Tech, Digitide Solutio, Unified Data, Qualitek Labs, and Tracxn Technolo.<BR><BR>Quality Snapshot: Excellent management risk is observed at eClerx Services, while Good management risk is found at Firstsour.Solu. and Digitide Solutio, and Average management risk is present at RPSG Ventures, Hinduja Global, Alldigi Tech, Unified Data, and Tracxn Technolo. Below Average management risk is noted for One Point One and Qualitek Labs. For Growth, Excellent growth is seen at RPSG Ventures and Unified Data, while Good growth is observed at One Point One and Average growth is found at Firstsour.Solu., Alldigi Tech, Digitide Solutio, and Hinduja Global, with Below Average growth at eClerx Services and Tracxn Technolo. Capital Structure ratings show Excellent at Alldigi Tech and Unified Data, Good at One Point One, Firstsour.Solu., and Digitide Solutio, while Average is noted for Qualitek Labs and Below Average for RPSG Ventures and Hinduja Global.<BR><BR>Return Snapshot: The peer with the highest 1-year return is Qualitek Labs at 37.46%, while Digitide Solutio has the lowest at -64.16%. One Point One's 1-year return is not available for comparison. Additionally, peers with negative six-month returns include eClerx Services, Digitide Solutio, Alldigi Tech, and Tracxn Technolo.

View full answer

Are One Point One Solutions Ltd latest results good or bad?

28-May-2026

One Point One Solutions Ltd's latest results show strong revenue growth with a record ₹96.20 crores in Q4 FY26, but declining operating margins and a low return on equity raise concerns about profitability, leading to a 'SELL' rating due to valuation and operational inefficiencies.

The latest results for One Point One Solutions Ltd show a mixed picture. On one hand, the company achieved a record revenue of ₹96.20 crores in Q4 FY26, which represents a substantial growth of 24.45% quarter-on-quarter and 43.48% year-on-year. Additionally, net profit rose to ₹10.32 crores, reflecting a 19.44% increase from the previous quarter and an 18.08% increase year-on-year.<BR><BR>However, there are significant concerns regarding profitability. The operating margin has contracted by 181 basis points to 22.58%, indicating rising costs that are not being offset by revenue growth. Furthermore, the company's return on equity (ROE) stands at a low 8.57%, which is below the average for its peers, highlighting issues with capital efficiency.<BR><BR>The stock has performed well recently, outperforming the Sensex, but this rally appears disconnected from the underlying fundamentals. Given the combination of strong revenue growth but declining margins and low ROE, the overall assessment leans towards caution. The company has been rated a 'SELL' due to these valuation concerns and operational inefficiencies, suggesting that while the headline figures may look good, the underlying trends are troubling.

View full answer

When is the next results date for One Point One Solutions Ltd?

20-May-2026

The next results date for One Point One Solutions Ltd is 27 May 2026.

The next results date for One Point One Solutions Ltd is scheduled for 27 May 2026.

View full answer

Is One Point One technically bullish or bearish?

03-Dec-2025

As of December 2, 2025, the market trend is neutral with mixed signals, showing mildly bullish momentum on the weekly MACD and KST, but bearish indications on the monthly MACD and moving averages, resulting in no clear direction.

As of 2 December 2025, the technical trend has changed from mildly bullish to sideways. The current stance is neutral, with mixed signals across different time frames. The weekly MACD is mildly bullish, while the monthly MACD is mildly bearish, indicating conflicting momentum. The Bollinger Bands show a bullish signal on the weekly chart but are mildly bearish on the monthly. Daily moving averages are mildly bearish, suggesting short-term weakness. The KST and Dow Theory both indicate a mildly bullish stance on the weekly, but monthly signals are bearish. Overall, the strength of the indicators points to a neutral position with no clear direction.

View full answer

How has been the historical performance of One Point One?

20-Nov-2025

One Point One has shown significant growth from March 2023 to March 2025, with net sales increasing from 140.25 Cr to 256.36 Cr and profit after tax rising from 8.79 Cr to 33.16 Cr, reflecting a strong upward trend in profitability and total assets. Despite negative cash flow from investing activities, the company has demonstrated robust financial performance and recovery.

Answer:<BR>The historical performance of One Point One shows significant growth in net sales and profitability over the years, particularly from March 2023 to March 2025.<BR><BR>Breakdown:<BR>One Point One's net sales have increased from 140.25 Cr in March 2023 to 256.36 Cr in March 2025, indicating a strong upward trend. Total operating income followed a similar trajectory, rising from 140.25 Cr to 256.36 Cr during the same period. The company's total expenditure, excluding depreciation, also grew from 107.13 Cr in March 2023 to 194.42 Cr in March 2025, primarily driven by employee costs, which increased from 86.17 Cr to 149.30 Cr. Operating profit, excluding other income, improved significantly from 33.12 Cr in March 2023 to 61.94 Cr in March 2025, while profit before tax rose from 12.82 Cr to 42.67 Cr. Consequently, profit after tax surged from 8.79 Cr in March 2023 to 33.16 Cr in March 2025, reflecting a robust PAT margin of 12.93% in the latest fiscal year. The company's total assets also expanded from 128.70 Cr in March 2023 to 497.76 Cr in March 2025, with total liabilities increasing from 128.70 Cr to 497.76 Cr. Cash flow from operating activities showed a positive trend, reaching 27.00 Cr in March 2025, although cash flow from investing activities was notably negative at -224.00 Cr. Overall, One Point One has demonstrated a strong recovery and growth trajectory in its financial performance over the past few years.

View full answer

Is One Point One overvalued or undervalued?

18-Nov-2025

As of November 17, 2025, One Point One is fairly valued with a PE ratio of 38.84 and an EV to EBITDA of 24.08, outperforming the Sensex with a 20.93% return over the past month, while its peers show varying valuations.

As of 17 November 2025, the valuation grade for One Point One has moved from expensive to fair. The company is currently fairly valued. Key ratios include a PE Ratio of 38.84, an EV to EBITDA of 24.08, and a ROE of 8.57%. <BR><BR>In comparison to peers, Firstsource Solutions has an attractive valuation with a PE of 38.81 and an EV to EBITDA of 20.19, while eClerx Services is categorized as very expensive with a PE of 36.38. Notably, One Point One's recent stock performance shows a 20.93% return over the past month, significantly outperforming the Sensex's 1.18% return in the same period.

View full answer

Who are the top shareholders of the One Point One?

17-Jul-2025

The top shareholders of One Point One include Akshay Chhabra with 30.62%, foreign institutional investors holding 16.12%, and individual investors owning 24.35%. The highest public shareholder is North Star Opportunities Fund Vcc-bull Value Incorporated Vcc Sub-fund with 2%, and there are no mutual funds involved.

The top shareholders of One Point One include the promoters, who hold the majority of the shares. The promoter with the highest holding is Akshay Chhabra, owning 30.62% of the company. Additionally, foreign institutional investors (FIIs) hold 16.12% of the shares through 19 different FIIs. The highest public shareholder is North Star Opportunities Fund Vcc-bull Value Incorporated Vcc Sub-fund, which holds 2%. Individual investors collectively own 24.35% of the company. There are no mutual funds currently holding shares in One Point One.

View full answer

What is the bonus history of the One Point One?

06-Jun-2025

One Point One has issued bonuses twice, with the latest being a 1:2 bonus announced on January 18, 2022, and a previous 1:2 bonus on April 24, 2019. This reflects the company's consistent practice of rewarding shareholders with bonus shares.

One Point One has a history of issuing bonuses, with two notable instances. The latest bonus was a 1:2 issue announced with an ex-date of January 18, 2022, and a record date of January 19, 2022. Prior to that, there was another 1:2 bonus issue with an ex-date of April 24, 2019, and a record date of April 25, 2019. This indicates a consistent approach to rewarding shareholders through bonus shares.

View full answer

Has One Point One declared dividend?

06-Jun-2025

One Point One Solutions Ltd has declared a 1% dividend, but the dividend yield is 0%, indicating it has not contributed to returns. The company has experienced significant price appreciation, resulting in substantial total returns over various periods.

One Point One Solutions Ltd has declared a 1% dividend.<BR><BR>Dividend Details:<BR>- Percentage announced: 1%<BR>- Ex-date: 12 Sep 19<BR><BR>Dividend Yield: 0%<BR><BR>Total Returns by Period:<BR>In the 6-month period, the price return was 10.85%, with a dividend return of 0%, resulting in a total return of 10.85%.<BR><BR>In the 1-year period, the price return was 21.41%, with a dividend return of 0%, resulting in a total return of 21.41%.<BR><BR>In the 2-year period, the price return was 189.82%, with a dividend return of 0%, resulting in a total return of 189.82%.<BR><BR>In the 3-year period, the price return was 545.32%, with a dividend return of 0%, resulting in a total return of 545.32%.<BR><BR>In the 4-year period, the price return was 19775.59%, with a dividend return of 0%, resulting in a total return of 19775.59%.<BR><BR>In the 5-year period, the price return was 33602.08%, with a dividend return of 0%, resulting in a total return of 33602.08%.<BR><BR>Overall, while One Point One Solutions Ltd has declared a dividend, the yield remains at 0%, indicating that the dividend has not contributed to the returns in recent periods. However, the company has shown significant price appreciation over time, leading to substantial total returns.

View full answer
iScoreScore
Click here to find our call on this stock
Strong Sell
Sell
Hold
Buy
Strong Buy

Dashboard

1

Strong ability to service debt as the company has a low Debt to EBITDA ratio of 3.03 times

 
2

Healthy long term growth as Net Sales has grown by an annual rate of 25.27% and Operating profit at 34.13%

 
3

The company has declared Positive results for the last 4 consecutive quarters

4

With ROCE of 7.3, it has a Attractive valuation with a 2.8 Enterprise value to Capital Employed

5

33.72% of Promoter Shares are Pledged

stock-summaryMojo Parameters

Mojo Parameters

Loading Valuation Snapshot...

Stock DNA

stock-summary
Industry

Commercial Services & Supplies

stock-summary
Market cap

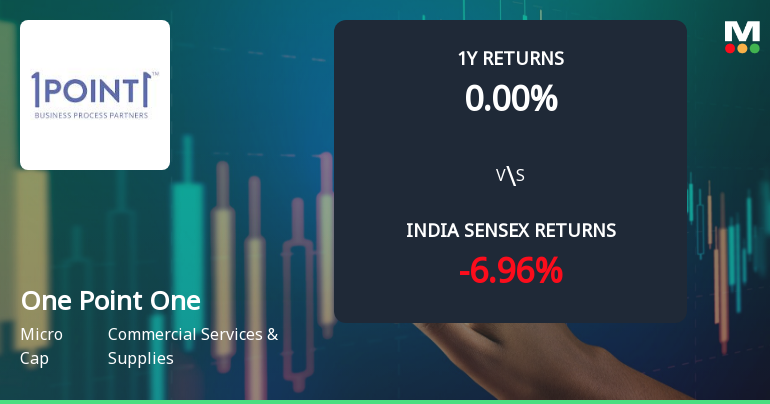
INR 1,525 Cr (Micro Cap)

stock-summary
P/E

39.00

stock-summary
Industry P/E

22

stock-summary
Dividend Yield

0.00%

stock-summary
Debt Equity

0.36

stock-summary
Return on Equity

8.79%

stock-summary
Price to Book

3.39

Revenue and Profits:
Net Sales:
96 Cr
(Quarterly Results - Mar 2026)
Net Profit:
10 Cr
stock-summaryTotal Returns
Total Returns (Price + Dividend) stock-summary
Icon
Company does not have enough history
Risk Adjusted Returns v/s stock-summary
Returns Beta
Icon
Beta has not been calculated since enough price history is not available
stock-summaryNews & Corporate Actions

Announcements stock-summary

Announcement under Regulation 30 (LODR)-Analyst / Investor Meet - Intimation

10-Jun-2026 | Source : BSE

In compliance with Regulation 30 of the SEBI (Listing Obligations and Disclosure Requirements) Regulations 2015 we hereby inform you that the Management of the Company will be participating in the Choice Institutional Equities Conference - InsightX 2026 on Friday 12th June 2026. Kindly take the same on your record. Please note that the schedule is subject to change based on the availability of the investors analysts or the Company. Please note that No Unpublished Price Sensitive Information (UPSI) will be disclosed during this meeting. The discussion will be based on the investor presentation already submitted to the Exchange on 27th March 2026. Request you to take the same on your records.

Disclosure under Regulation 30A of LODR

01-Jun-2026 | Source : BSE

Dear Sir/ Madam Please find attached Transcript of the Post-Earnings Conference Call held on financial statements of the company for quarter and year ended 31 March 2026.

Announcement under Regulation 30 (LODR)-Newspaper Publication

30-May-2026 | Source : BSE

COPY OF NEWSPAPER Publication

Corporate Actions stock-summary

stock-summary
BOARD MEETING

No Upcoming Board Meetings

stock-summary
DIVIDEND

One Point One Solutions Ltd has declared 1% dividend, ex-date: 12 Sep 19

stock-summary
SPLITS

One Point One Solutions Ltd has announced 2:10 stock split, ex-date: 18 Jan 22

stock-summary
BONUS

One Point One Solutions Ltd has announced 1:2 bonus issue, ex-date: 18 Jan 22

stock-summary
RIGHTS

No Rights history available

stock-summaryKey Factors

Quality key factors stock-summary

Factor
Value
Sales Growth (5y)
25.27%
EBIT Growth (5y)
34.13%
EBIT to Interest (avg)
4.02
Debt to EBITDA (avg)
1.88
Net Debt to Equity (avg)
0.36
Sales to Capital Employed (avg)
0.87
Tax Ratio
26.36%
Dividend Payout Ratio
0
Pledged Shares
33.72%
Institutional Holding
9.86%
ROCE (avg)
8.79%
ROE (avg)
11.32%

Valuation key factors

Factor
Value
P/E Ratio
39
Industry P/E
22
Price to Book Value
3.39
EV to EBIT
37.98
EV to EBITDA
23.03
EV to Capital Employed
2.76
EV to Sales
5.34
PEG Ratio
2.57
Dividend Yield
NA
ROCE (Latest)
7.27%
ROE (Latest)
8.79%

Technicals key factors

Indicator
Weekly
Monthly
MACD
RSI
Bollinger Bands
KST
Dow Theory
Mildly Bullish
OBV
Mildly Bullish
stock-summary Technical Indicator Scale: Bearish, Mildly Bearish, Sideways, Mildly Bullish, Bullish  Turned 
stock-summaryShareholding
Shareholding Snapshot : Mar 2026stock-summary
Shareholding Compare (%holding) stock-summary
Majority shareholders

Promoters

Pledged Promoter Holdings

33.7161

Mutual Funds

Held by 0 Schemes

FIIs

Held by 13 FIIs (7.02%)

Promoter with highest holding

Akshay Chhabra (30.62%)

Highest Public shareholder

Gkk Capital Markets Private Limited (2.85%)

Individual Investors Holdings

25.33%

stock-summaryFinancial
[
  {
    "link": "quarterly",
    "btn_text": "All Quarterly Results",
    "header": "Quarterly Results Snapshot (Consolidated) - Mar'26 - YoY",
    "rhs": [
      {
        "prefix": "Net Sales ",
        "suffix": "YoY Growth in quarter ended Mar 2026 is 43.48% vs 28.06% in Mar 2025",
        "dir": 1
      },
      {
        "prefix": "Consolidated Net Profit ",
        "suffix": "YoY Growth in quarter ended Mar 2026 is 18.08% vs 31.23% in Mar 2025",
        "dir": -1
      }
    ],
    "table": {
      "header": [
        "Mar'26",
        "Mar'25",
        "Change(%)"
      ],
      "body": [
        {
          "field": "Net Sales",
          "val1": "96.20",
          "val2": "67.05",
          "chgp": "43.48%",
          "chgp_class": "positive"
        },
        {
          "field": "Operating Profit (PBDIT) excl Other Income",
          "val1": "21.72",
          "val2": "12.27",
          "chgp": "77.02%",
          "chgp_class": "positive"
        },
        {
          "field": "Interest",
          "val1": "3.00",
          "val2": "1.76",
          "chgp": "70.45%",
          "chgp_class": "negative"
        },
        {
          "field": "Exceptional Items",
          "val1": "0.00",
          "val2": "0.00",
          "chgp": "",
          "chgp_class": "neutral"
        },
        {
          "field": "Consolidate Net Profit",
          "val1": "10.32",
          "val2": "8.74",
          "chgp": "18.08%",
          "chgp_class": "positive"
        },
        {
          "field": "Operating Profit Margin (Excl OI)",
          "val1": "22.58%",
          "val2": "18.30%",
          "chgp": "4.28%",
          "chgp_class": "positive"
        }
      ]
    }
  },
  {
    "link": "half-yearly",
    "btn_text": "All Half Yearly Results",
    "header": "Half Yearly Results Snapshot (Consolidated) - Sep'25",
    "rhs": [
      {
        "prefix": "Net Sales ",
        "suffix": " Growth in half year ended Sep 2025 is 13.14% vs 63.51% in Sep 2024",
        "dir": -1
      },
      {
        "prefix": "Consolidated Net Profit ",
        "suffix": " Growth in half year ended Sep 2025 is 20.64% vs 82.74% in Sep 2024",
        "dir": -1
      }
    ],
    "table": {
      "header": [
        "Sep'25",
        "Sep'24",
        "Change(%)"
      ],
      "body": [
        {
          "field": "Net Sales",
          "val1": "139.88",
          "val2": "123.63",
          "chgp": "13.14%",
          "chgp_class": "positive"
        },
        {
          "field": "Operating Profit (PBDIT) excl Other Income",
          "val1": "32.11",
          "val2": "33.88",
          "chgp": "-5.22%",
          "chgp_class": "negative"
        },
        {
          "field": "Interest",
          "val1": "3.60",
          "val2": "2.91",
          "chgp": "23.71%",
          "chgp_class": "negative"
        },
        {
          "field": "Exceptional Items",
          "val1": "0.00",
          "val2": "0.00",
          "chgp": "",
          "chgp_class": "neutral"
        },
        {
          "field": "Consolidate Net Profit",
          "val1": "19.29",
          "val2": "15.99",
          "chgp": "20.64%",
          "chgp_class": "positive"
        },
        {
          "field": "Operating Profit Margin (Excl OI)",
          "val1": "22.96%",
          "val2": "27.40%",
          "chgp": "-4.44%",
          "chgp_class": "negative"
        }
      ]
    }
  },
  {
    "link": "nine-monthly",
    "btn_text": "All Nine Monthly Results",
    "header": "Nine Monthly Results Snapshot (Consolidated) - Dec'25",
    "rhs": [
      {
        "prefix": "Net Sales ",
        "suffix": "YoY Growth in nine months ended Dec 2025 is 14.72% vs 61.24% in Dec 2024",
        "dir": -1
      },
      {
        "prefix": "Consolidated Net Profit ",
        "suffix": "YoY Growth in nine months ended Dec 2025 is 14.37% vs 65.90% in Dec 2024",
        "dir": -1
      }
    ],
    "table": {
      "header": [
        "Dec'25",
        "Dec'24",
        "Change(%)"
      ],
      "body": [
        {
          "field": "Net Sales",
          "val1": "217.18",
          "val2": "189.31",
          "chgp": "14.72%",
          "chgp_class": "positive"
        },
        {
          "field": "Operating Profit (PBDIT) excl Other Income",
          "val1": "50.96",
          "val2": "49.67",
          "chgp": "2.60%",
          "chgp_class": "positive"
        },
        {
          "field": "Interest",
          "val1": "5.37",
          "val2": "4.94",
          "chgp": "8.70%",
          "chgp_class": "negative"
        },
        {
          "field": "Exceptional Items",
          "val1": "-1.47",
          "val2": "0.00",
          "chgp": "",
          "chgp_class": "neutral"
        },
        {
          "field": "Consolidate Net Profit",
          "val1": "27.93",
          "val2": "24.42",
          "chgp": "14.37%",
          "chgp_class": "positive"
        },
        {
          "field": "Operating Profit Margin (Excl OI)",
          "val1": "23.46%",
          "val2": "26.24%",
          "chgp": "-2.78%",
          "chgp_class": "negative"
        }
      ]
    }
  },
  {
    "link": "annual",
    "btn_text": "All Annual Results",
    "header": "Annual Results Snapshot (Consolidated) - Mar'26",
    "rhs": [
      {
        "prefix": "Net Sales ",
        "suffix": "YoY Growth in year ended Mar 2026 is 22.24% vs 51.01% in Mar 2025",
        "dir": -1
      },
      {
        "prefix": "Consolidated Net Profit ",
        "suffix": "YoY Growth in year ended Mar 2026 is 15.35% vs 55.10% in Mar 2025",
        "dir": -1
      }
    ],
    "table": {
      "header": [
        "Mar'26",
        "Mar'25",
        "Change(%)"
      ],
      "body": [
        {
          "field": "Net Sales",
          "val1": "313.38",
          "val2": "256.36",
          "chgp": "22.24%",
          "chgp_class": "positive"
        },
        {
          "field": "Operating Profit (PBDIT) excl Other Income",
          "val1": "72.70",
          "val2": "61.94",
          "chgp": "17.37%",
          "chgp_class": "positive"
        },
        {
          "field": "Interest",
          "val1": "8.37",
          "val2": "6.70",
          "chgp": "24.93%",
          "chgp_class": "negative"
        },
        {
          "field": "Exceptional Items",
          "val1": "-1.47",
          "val2": "0.00",
          "chgp": "",
          "chgp_class": "neutral"
        },
        {
          "field": "Consolidate Net Profit",
          "val1": "38.25",
          "val2": "33.16",
          "chgp": "15.35%",
          "chgp_class": "positive"
        },
        {
          "field": "Operating Profit Margin (Excl OI)",
          "val1": "23.20%",
          "val2": "24.16%",
          "chgp": "-0.96%",
          "chgp_class": "negative"
        }
      ]
    }
  }
]

Quarterly Results Snapshot (Consolidated) - Mar'26 - YoYstock-summary

Mar'26
Mar'25
Change(%)
Net Sales
96.20
67.05
43.48%
Operating Profit (PBDIT) excl Other Income
21.72
12.27
77.02%
Interest
3.00
1.76
70.45%
Exceptional Items
0.00
0.00
Consolidate Net Profit
10.32
8.74
18.08%
Operating Profit Margin (Excl OI)
22.58%
18.30%
4.28%
Values in Rs Cr.
Direction Arrows
Net Sales

YoY Growth in quarter ended Mar 2026 is 43.48% vs 28.06% in Mar 2025

Direction Arrows
Consolidated Net Profit

YoY Growth in quarter ended Mar 2026 is 18.08% vs 31.23% in Mar 2025

Half Yearly Results Snapshot (Consolidated) - Sep'25stock-summary

Sep'25
Sep'24
Change(%)
Net Sales
139.88
123.63
13.14%
Operating Profit (PBDIT) excl Other Income
32.11
33.88
-5.22%
Interest
3.60
2.91
23.71%
Exceptional Items
0.00
0.00
Consolidate Net Profit
19.29
15.99
20.64%
Operating Profit Margin (Excl OI)
22.96%
27.40%
-4.44%
Values in Rs Cr.
Direction Arrows
Net Sales

Growth in half year ended Sep 2025 is 13.14% vs 63.51% in Sep 2024

Direction Arrows
Consolidated Net Profit

Growth in half year ended Sep 2025 is 20.64% vs 82.74% in Sep 2024

Nine Monthly Results Snapshot (Consolidated) - Dec'25stock-summary

Dec'25
Dec'24
Change(%)
Net Sales
217.18
189.31
14.72%
Operating Profit (PBDIT) excl Other Income
50.96
49.67
2.60%
Interest
5.37
4.94
8.70%
Exceptional Items
-1.47
0.00
Consolidate Net Profit
27.93
24.42
14.37%
Operating Profit Margin (Excl OI)
23.46%
26.24%
-2.78%
Values in Rs Cr.
Direction Arrows
Net Sales

YoY Growth in nine months ended Dec 2025 is 14.72% vs 61.24% in Dec 2024

Direction Arrows
Consolidated Net Profit

YoY Growth in nine months ended Dec 2025 is 14.37% vs 65.90% in Dec 2024

Annual Results Snapshot (Consolidated) - Mar'26stock-summary

Mar'26
Mar'25
Change(%)
Net Sales
313.38
256.36
22.24%
Operating Profit (PBDIT) excl Other Income
72.70
61.94
17.37%
Interest
8.37
6.70
24.93%
Exceptional Items
-1.47
0.00
Consolidate Net Profit
38.25
33.16
15.35%
Operating Profit Margin (Excl OI)
23.20%
24.16%
-0.96%
Values in Rs Cr.
Direction Arrows
Net Sales

YoY Growth in year ended Mar 2026 is 22.24% vs 51.01% in Mar 2025

Direction Arrows
Consolidated Net Profit

YoY Growth in year ended Mar 2026 is 15.35% vs 55.10% in Mar 2025

stock-summaryCompany CV
About One Point One Solutions Ltd stock-summary
stock-summary
One Point One Solutions Ltd
Micro Cap
Commercial Services & Supplies
One Point One Solutions Limited was originally incorporated as a Private Limited Company with the name "DSA Learning Systems Private Limited" at Mumbai, Maharashtra on May 30, 2008. The name of the Company was changed to One Point One Solutions Private Limited on December 17, 2013. Subsequently, the Company was converted into a Public Limited Company and the name was changed to "One Point One Solutions Limited" on October 09, 2017.
Company Coordinates stock-summary
Company Details
International Infotech Park, T-762 Tower-7 Vashi Navi Mumbai Maharashtra : 400703
stock-summary
Tel: 91-22-61656363
stock-summary
investors@1point1.in
Registrar Details
Link Intime India Pvt Ltd, C-13 Pannalal Silk Compound, L B S Marg, Bhandup , Mumbai