
Compare Onelife Capital with Similar Stocks
Dashboard
With a Operating Losses, the company has a Weak Long Term Fundamental Strength
The company has declared positive results in Mar'2026 after 2 consecutive negative quarters
With ROE of 7.4, it has a Attractive valuation with a 1.4 Price to Book Value
71% of Promoter Shares are Pledged
Market Beating performance in long term as well as near term
Total Returns (Price + Dividend) 
Onelife Capital for the last several years.
Risk Adjusted Returns v/s
Returns Beta

News
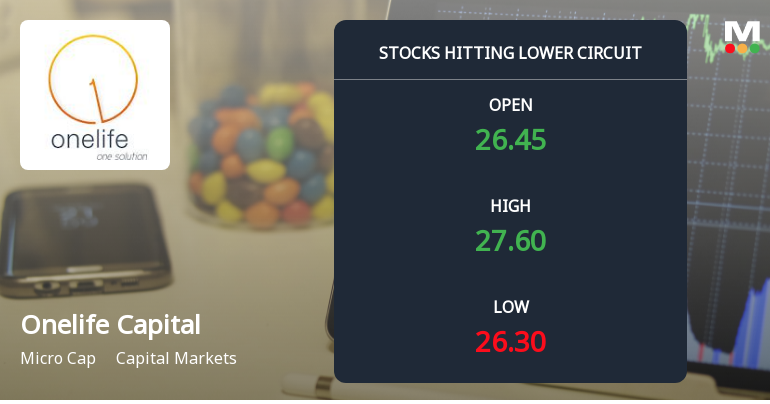
Onelife Capital Advisors Ltd Locks at Lower Circuit With 1.44% Loss — Sellers Queue, No Buyers in Sight
At Rs 25.07, sellers were still queuing — but there were no buyers willing to take the other side. Onelife Capital Advisors Ltd locked at its lower circuit of 5% on 04 Jun 2026, with unfilled sell orders and a frozen price that capped losses at 1.44% for the day.
Read full news article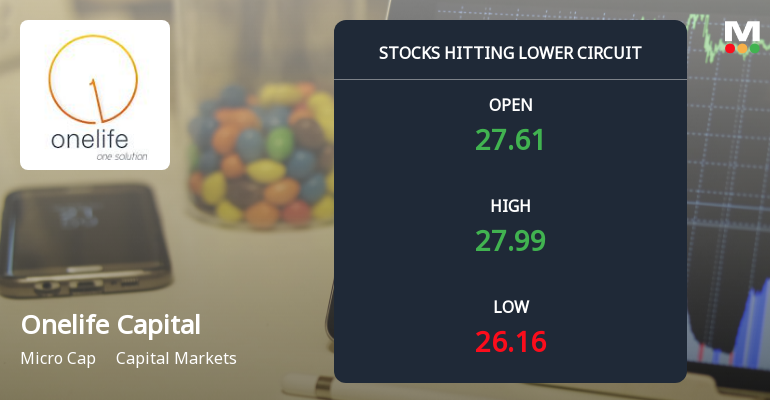
Below All Moving Averages and Now at Lower Circuit: Onelife Capital Advisors Ltd Loses 4.98% in a Single Session
At Rs 26.16, sellers were still queuing — but there were no buyers willing to take the other side. Onelife Capital Advisors Ltd locked at its lower circuit of 5% on 3 Jun 2026, with unfilled sell orders and a frozen price, signalling persistent selling pressure despite the price floor.
Read full news article
Onelife Capital Advisors Ltd is Rated Hold
Onelife Capital Advisors Ltd is rated 'Hold' by MarketsMOJO, with this rating last updated on 01 June 2026. However, the analysis and financial metrics discussed here reflect the stock's current position as of 03 June 2026, providing investors with the latest insights into its performance and outlook.
Read full news article Announcements
Shareholder Meeting / Postal Ballot-Notice of Postal Ballot
09-Jun-2026 | Source : BSEEnclosed herewith postal ballot notice
Announcement under Regulation 30 (LODR)-Newspaper Publication
02-Jun-2026 | Source : BSEEnclosed herewith Newspaper publication of Financial Results for the fourth quarter and year ended 31st March 2026
Corporate Action-Board approves Dividend
30-May-2026 | Source : BSEEnclosed herewith recommendation of Final dividend of 0.1% i.e Rs 01 Paisa per equty share on face value of Rs 10 each
Corporate Actions

No Upcoming Board Meetings

No Dividend history available

No Splits history available

No Bonus history available

Onelife Capital Advisors Ltd has announced 300:167 rights issue, ex-date: 16 Feb 26
Quality key factors
Valuation key factors
Technicals key factors
 Technical Indicator Scale: Bearish, Mildly Bearish, Sideways, Mildly Bullish, Bullish Turned
 Shareholding Snapshot : Mar 2026
Shareholding Compare (%holding)
Non Institution
70.9992
Held by 0 Schemes
Held by 0 FIIs
Naig Prabhakar K (25.62%)
Uday Zaveri (6.33%)
68.04%
Quarterly Results Snapshot (Consolidated) - Mar'26 - QoQ

QoQ Growth in quarter ended Mar 2026 is 664.71% vs -86.79% in Dec 2025
QoQ Growth in quarter ended Mar 2026 is 811.18% vs 62.39% in Dec 2025
Half Yearly Results Snapshot (Consolidated) - Sep'25

Growth in half year ended Sep 2025 is -45.99% vs 179.49% in Sep 2024
Growth in half year ended Sep 2025 is 18.34% vs -833.33% in Sep 2024
Nine Monthly Results Snapshot (Consolidated) - Dec'25
YoY Growth in nine months ended Dec 2025 is -48.06% vs 118.95% in Dec 2024
YoY Growth in nine months ended Dec 2025 is 24.21% vs -665.52% in Dec 2024
Annual Results Snapshot (Consolidated) - Mar'26
YoY Growth in year ended Mar 2026 is -19.24% vs -69.51% in Mar 2025
YoY Growth in year ended Mar 2026 is 204.28% vs -1,417.95% in Mar 2025
About Onelife Capital Advisors Ltd

Company Coordinates


